29
/es/
es
AIzaSyAYiBZKx7MnpbEhh9jyipgxe19OcubqV5w
April 1, 2024
38590
IDA blend
IDB
false
2
1
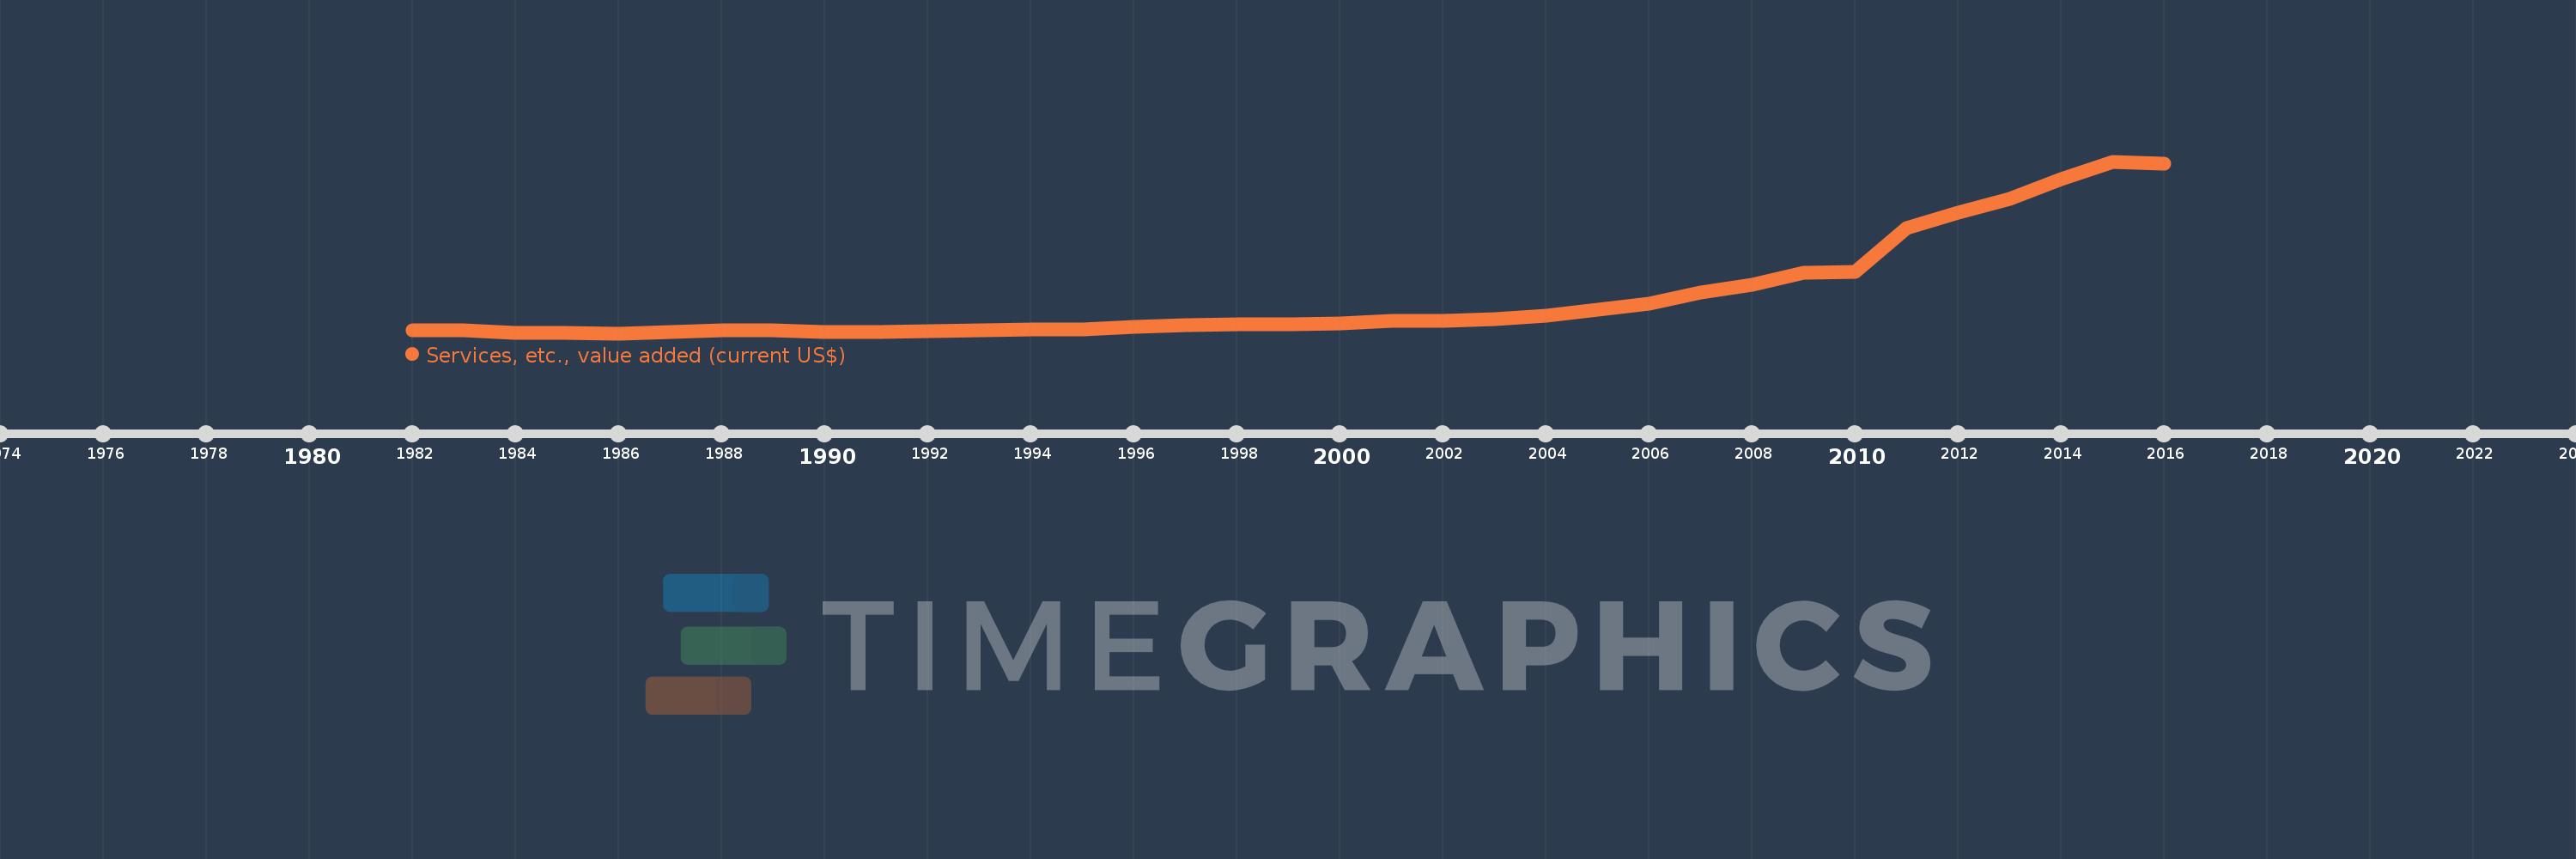
Services, etc., value added (current US$)
2016,2015,2014,2013,2012,2011,2010,2009,2008,2007,2006,2005,2004,2003,2002,2001,2000,1999,1998,1997,1996,1995,1994,1993,1992,1991,1990,1989,1988,1987,1986,1985,1984,1983,1982
Estas estadísticas en otros países:
AfghanistanAlbaniaAlgeriaAndorraAngolaAntigua and BarbudaArab WorldArgentinaArmeniaArubaAustraliaAustriaAzerbaijanBahamas, TheBahrainBangladeshBarbadosBelarusBelgiumBelizeBeninBermudaBhutanBoliviaBosnia and HerzegovinaBotswanaBrazilBrunei DarussalamBulgariaBurkina FasoBurundiCabo VerdeCambodiaCameroonCanadaCaribbean small statesCentral African RepublicCentral Europe and the BalticsChadChileChinaColombiaComorosCongo, Dem. Rep.Congo, Rep.Costa RicaCote d'IvoireCroatiaCubaCyprusCzech RepublicDenmarkDjiboutiDominicaDominican RepublicEarly-demographic dividendEast Asia & PacificEast Asia & Pacific (excluding high income)East Asia & Pacific (IDA & IBRD countries)EcuadorEgypt, Arab Rep.El SalvadorEquatorial GuineaEritreaEstoniaEthiopiaEuro areaEurope & Central AsiaEurope & Central Asia (excluding high income)Europe & Central Asia (IDA & IBRD countries)European UnionFaroe IslandsFijiFinlandFragile and conflict affected situationsFranceGabonGambia, TheGeorgiaGermanyGhanaGreeceGrenadaGuatemalaGuineaGuinea-BissauGuyanaHeavily indebted poor countries (HIPC)High incomeHondurasHong Kong SAR, ChinaHungaryIBRD onlyIcelandIDA & IBRD totalIDA blendIDA onlyIDA totalIndiaIndonesiaIran, Islamic Rep.IraqIrelandItalyJamaicaJapanJordanKazakhstanKenyaKiribatiKorea, Rep.KosovoKuwaitKyrgyz RepublicLao PDRLate-demographic dividendLatin America & Caribbean Latin America & Caribbean (excluding high income)Latin America & the Caribbean (IDA & IBRD countries)LatviaLeast developed countries: UN classificationLebanonLesothoLiberiaLibyaLithuaniaLow & middle incomeLow incomeLower middle incomeLuxembourgMacao SAR, ChinaMacedonia, FYRMadagascarMalawiMalaysiaMaldivesMaliMaltaMarshall IslandsMauritaniaMauritiusMexicoMicronesia, Fed. Sts.Middle East & North AfricaMiddle East & North Africa (excluding high income)Middle East & North Africa (IDA & IBRD countries)Middle incomeMoldovaMongoliaMontenegroMoroccoMozambiqueMyanmarNamibiaNepalNetherlandsNew CaledoniaNew ZealandNicaraguaNigerNigeriaNorth AmericaNorwayOECD membersOmanOther small statesPacific island small statesPakistanPalauPanamaPapua New GuineaParaguayPeruPhilippinesPolandPortugalPost-demographic dividendPre-demographic dividendPuerto RicoQatarRomaniaRussian FederationRwandaSamoaSao Tome and PrincipeSaudi ArabiaSenegalSerbiaSeychellesSierra LeoneSingaporeSlovak RepublicSloveniaSmall statesSolomon IslandsSouth AfricaSouth AsiaSouth Asia (IDA & IBRD)SpainSri LankaSt. Kitts and NevisSt. LuciaSt. Vincent and the GrenadinesSub-Saharan Africa Sub-Saharan Africa (excluding high income)Sub-Saharan Africa (IDA & IBRD countries)SudanSurinameSwazilandSwedenSwitzerlandSyrian Arab RepublicTajikistanTanzaniaThailandTimor-LesteTogoTongaTrinidad and TobagoTunisiaTurkeyTurkmenistanTuvaluUgandaUkraineUnited Arab EmiratesUnited KingdomUnited StatesUpper middle incomeUruguayUzbekistanVanuatuVenezuela, RBVietnamWest Bank and GazaWorldYemen, Rep.ZambiaZimbabwe línea de tiempo (timeline):
En esta escala de tiempo se presenta un gráfico de 1982 y 2016 de IDA blend. Los datos de 1981 están ausentes. El número de observaciones reales por fecha: 35.
Fuente (nombre):
Indicadores del desarrollo mundial
Fuente (organización):
World Bank national accounts data, and OECD National Accounts data files.
Categorías:
Economy & Growth
Se ha actualizado:
23 abr 2017 año
Los indicadores de los cambios de valor en los últimos años
Mínimo:
44.686 bn
1 ene 1986 año
Máximo:
639.666 bn
1 ene 2015 año
A la fecha de observación
Valor
Cambio absoluto
El cambio con respecto al valor anterior
1 ene 1982 año
54.911 bn
+54.911 bn
0.0%
1 ene 1983 año
53.844 bn
-1.067 bn
-1.94%
1 ene 1984 año
47.487 bn
-6.357 bn
-11.81%
1 ene 1985 año
45.071 bn
-2.416 bn
-5.09%
1 ene 1986 año
44.686 bn
-385.073 millones
-0.85%
1 ene 1987 año
49.505 bn
+4.819 bn
10.79%
1 ene 1988 año
55.566 bn
+6.061 bn
12.24%
1 ene 1989 año
54.393 bn
-1.174 bn
-2.11%
1 ene 1990 año
48.402 bn
-5.99 bn
-11.01%
1 ene 1991 año
50.41 bn
+2.008 bn
4.15%
1 ene 1992 año
53.117 bn
+2.706 bn
5.37%
1 ene 1993 año
54.049 bn
+932.679 millones
1.76%
1 ene 1994 año
56.921 bn
+2.872 bn
5.31%
1 ene 1995 año
58.764 bn
+1.843 bn
3.24%
1 ene 1996 año
67.428 bn
+8.664 bn
14.74%
1 ene 1997 año
74.065 bn
+6.637 bn
9.84%
1 ene 1998 año
76.133 bn
+2.068 bn
2.79%
1 ene 1999 año
76.224 bn
+91.152 millones
0.12%
1 ene 2000 año
78.76 bn
+2.535 bn
3.33%
1 ene 2001 año
87.478 bn
+8.718 bn
11.07%
1 ene 2002 año
88.887 bn
+1.409 bn
1.61%
1 ene 2003 año
93.368 bn
+4.481 bn
5.04%
1 ene 2004 año
106.118 bn
+12.75 bn
13.66%
1 ene 2005 año
126.197 bn
+20.079 bn
18.92%
1 ene 2006 año
147.186 bn
+20.989 bn
16.63%
1 ene 2007 año
185.787 bn
+38.601 bn
26.23%
1 ene 2008 año
213.447 bn
+27.66 bn
14.89%
1 ene 2009 año
254.199 bn
+40.752 bn
19.09%
1 ene 2010 año
256.96 bn
+2.761 bn
1.09%
1 ene 2011 año
409.597 bn
+152.638 bn
59.4%
1 ene 2012 año
462.846 bn
+53.249 bn
13.0%
1 ene 2013 año
511.561 bn
+48.714 bn
10.52%
1 ene 2014 año
579.467 bn
+67.907 bn
13.27%
1 ene 2015 año
639.666 bn
+60.199 bn
10.39%
1 ene 2016 año
632.396 bn
-7.271 bn
-1.14%
Ranking de los países por los datos estadísticos actuales


Comentarios: