29
/es/
es
AIzaSyAYiBZKx7MnpbEhh9jyipgxe19OcubqV5w
April 1, 2024
27715
East Asia & Pacific
EAS
false
2
1
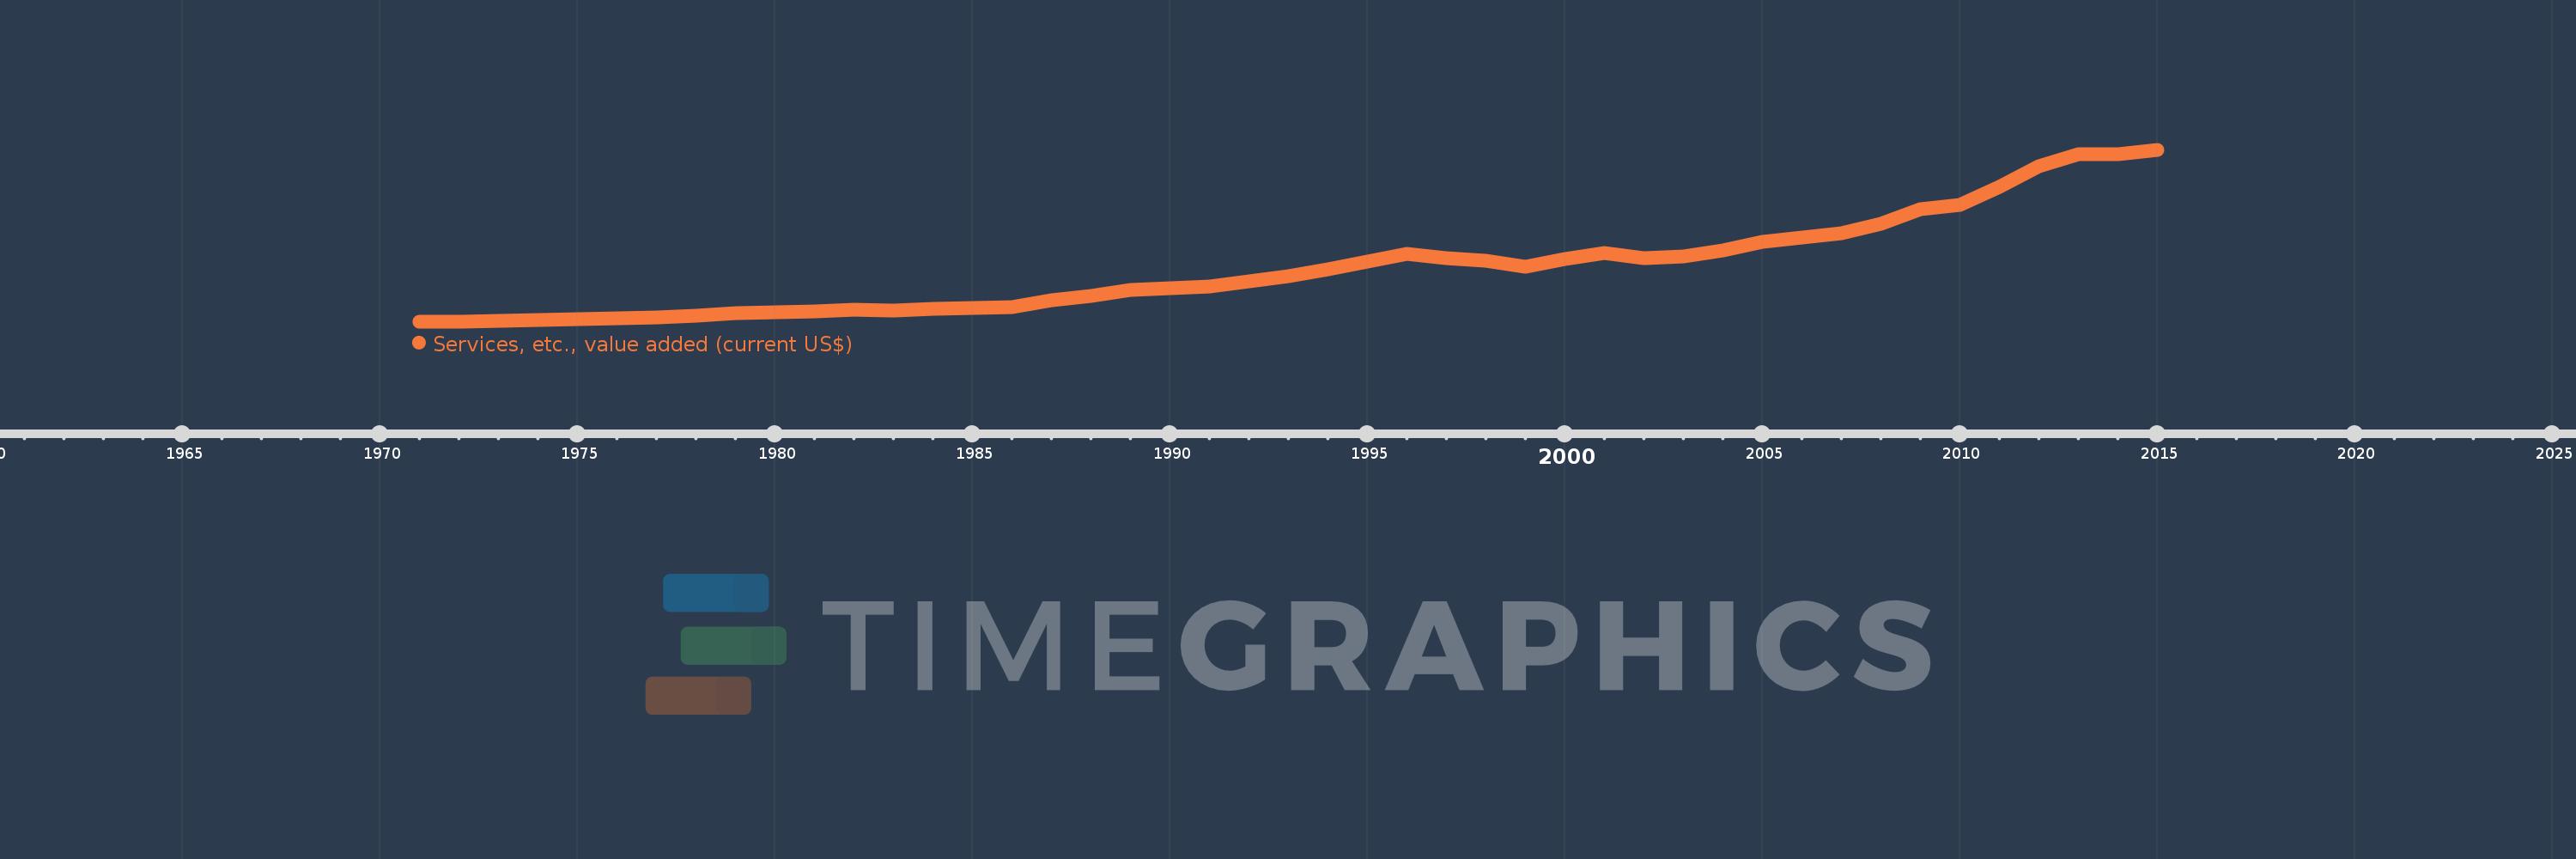
Services, etc., value added (current US$)
2015,2014,2013,2012,2011,2010,2009,2008,2007,2006,2005,2004,2003,2002,2001,2000,1999,1998,1997,1996,1995,1994,1993,1992,1991,1990,1989,1988,1987,1986,1985,1984,1983,1982,1981,1980,1979,1978,1977,1976,1975,1974,1973,1972,1971
Estas estadísticas en otros países:
AfghanistanAlbaniaAlgeriaAndorraAngolaAntigua and BarbudaArab WorldArgentinaArmeniaArubaAustraliaAustriaAzerbaijanBahamas, TheBahrainBangladeshBarbadosBelarusBelgiumBelizeBeninBermudaBhutanBoliviaBosnia and HerzegovinaBotswanaBrazilBrunei DarussalamBulgariaBurkina FasoBurundiCabo VerdeCambodiaCameroonCanadaCaribbean small statesCentral African RepublicCentral Europe and the BalticsChadChileChinaColombiaComorosCongo, Dem. Rep.Congo, Rep.Costa RicaCote d'IvoireCroatiaCubaCyprusCzech RepublicDenmarkDjiboutiDominicaDominican RepublicEarly-demographic dividendEast Asia & PacificEast Asia & Pacific (excluding high income)East Asia & Pacific (IDA & IBRD countries)EcuadorEgypt, Arab Rep.El SalvadorEquatorial GuineaEritreaEstoniaEthiopiaEuro areaEurope & Central AsiaEurope & Central Asia (excluding high income)Europe & Central Asia (IDA & IBRD countries)European UnionFaroe IslandsFijiFinlandFragile and conflict affected situationsFranceGabonGambia, TheGeorgiaGermanyGhanaGreeceGrenadaGuatemalaGuineaGuinea-BissauGuyanaHeavily indebted poor countries (HIPC)High incomeHondurasHong Kong SAR, ChinaHungaryIBRD onlyIcelandIDA & IBRD totalIDA blendIDA onlyIDA totalIndiaIndonesiaIran, Islamic Rep.IraqIrelandItalyJamaicaJapanJordanKazakhstanKenyaKiribatiKorea, Rep.KosovoKuwaitKyrgyz RepublicLao PDRLate-demographic dividendLatin America & Caribbean Latin America & Caribbean (excluding high income)Latin America & the Caribbean (IDA & IBRD countries)LatviaLeast developed countries: UN classificationLebanonLesothoLiberiaLibyaLithuaniaLow & middle incomeLow incomeLower middle incomeLuxembourgMacao SAR, ChinaMacedonia, FYRMadagascarMalawiMalaysiaMaldivesMaliMaltaMarshall IslandsMauritaniaMauritiusMexicoMicronesia, Fed. Sts.Middle East & North AfricaMiddle East & North Africa (excluding high income)Middle East & North Africa (IDA & IBRD countries)Middle incomeMoldovaMongoliaMontenegroMoroccoMozambiqueMyanmarNamibiaNepalNetherlandsNew CaledoniaNew ZealandNicaraguaNigerNigeriaNorth AmericaNorwayOECD membersOmanOther small statesPacific island small statesPakistanPalauPanamaPapua New GuineaParaguayPeruPhilippinesPolandPortugalPost-demographic dividendPre-demographic dividendPuerto RicoQatarRomaniaRussian FederationRwandaSamoaSao Tome and PrincipeSaudi ArabiaSenegalSerbiaSeychellesSierra LeoneSingaporeSlovak RepublicSloveniaSmall statesSolomon IslandsSouth AfricaSouth AsiaSouth Asia (IDA & IBRD)SpainSri LankaSt. Kitts and NevisSt. LuciaSt. Vincent and the GrenadinesSub-Saharan Africa Sub-Saharan Africa (excluding high income)Sub-Saharan Africa (IDA & IBRD countries)SudanSurinameSwazilandSwedenSwitzerlandSyrian Arab RepublicTajikistanTanzaniaThailandTimor-LesteTogoTongaTrinidad and TobagoTunisiaTurkeyTurkmenistanTuvaluUgandaUkraineUnited Arab EmiratesUnited KingdomUnited StatesUpper middle incomeUruguayUzbekistanVanuatuVenezuela, RBVietnamWest Bank and GazaWorldYemen, Rep.ZambiaZimbabwe línea de tiempo (timeline):
En esta escala de tiempo se presenta un gráfico de 1971 y 2015 de East Asia & Pacific. Los datos de 1970 están ausentes. El número de observaciones reales por fecha: 45.
Fuente (nombre):
Indicadores del desarrollo mundial
Fuente (organización):
World Bank national accounts data, and OECD National Accounts data files.
Categorías:
Economy & Growth
Se ha actualizado:
23 abr 2017 año
Los indicadores de los cambios de valor en los últimos años
En promedio:
3.906 billones
Mínimo:
176.446 bn
1 ene 1971 año
Máximo:
12.062 billones
1 ene 2015 año
A la fecha de observación
Valor
Cambio absoluto
El cambio con respecto al valor anterior
1 ene 1971 año
176.446 bn
+176.446 bn
0.0%
1 ene 1972 año
199.799 bn
+23.353 bn
13.24%
1 ene 1973 año
258.602 bn
+58.803 bn
29.43%
1 ene 1974 año
340.321 bn
+81.719 bn
31.6%
1 ene 1975 año
399.024 bn
+58.703 bn
17.25%
1 ene 1976 año
443.276 bn
+44.252 bn
11.09%
1 ene 1977 año
494.463 bn
+51.187 bn
11.55%
1 ene 1978 año
600.75 bn
+106.287 bn
21.5%
1 ene 1979 año
789.87 bn
+189.12 bn
31.48%
1 ene 1980 año
847.714 bn
+57.845 bn
7.32%
1 ene 1981 año
911.729 bn
+64.014 bn
7.55%
1 ene 1982 año
1.008 billones
+96.052 bn
10.54%
1 ene 1983 año
994.958 bn
-12.823 bn
-1.27%
1 ene 1984 año
1.075 billones
+80.355 bn
8.08%
1 ene 1985 año
1.146 billones
+70.356 bn
6.54%
1 ene 1986 año
1.222 billones
+76.48 bn
6.68%
1 ene 1987 año
1.654 billones
+432.151 bn
35.36%
1 ene 1988 año
1.994 billones
+339.712 bn
20.54%
1 ene 1989 año
2.411 billones
+417.479 bn
20.94%
1 ene 1990 año
2.517 billones
+105.299 bn
4.37%
1 ene 1991 año
2.633 billones
+116.223 bn
4.62%
1 ene 1992 año
3.013 billones
+379.719 bn
14.42%
1 ene 1993 año
3.351 billones
+337.808 bn
11.21%
1 ene 1994 año
3.844 billones
+493.133 bn
14.72%
1 ene 1995 año
4.326 billones
+481.881 bn
12.54%
1 ene 1996 año
4.882 billones
+556.202 bn
12.86%
1 ene 1997 año
4.62 billones
-261.9 bn
-5.36%
1 ene 1998 año
4.424 billones
-195.89 bn
-4.24%
1 ene 1999 año
4.001 billones
-423.216 bn
-9.57%
1 ene 2000 año
4.55 billones
+549.659 bn
13.74%
1 ene 2001 año
4.92 billones
+369.507 bn
8.12%
1 ene 2002 año
4.606 billones
-314.137 bn
-6.39%
1 ene 2003 año
4.686 billones
+80.551 bn
1.75%
1 ene 2004 año
5.135 billones
+448.397 bn
9.57%
1 ene 2005 año
5.704 billones
+569.516 bn
11.09%
1 ene 2006 año
6.04 billones
+336.031 bn
5.89%
1 ene 2007 año
6.3 billones
+259.337 bn
4.29%
1 ene 2008 año
6.958 billones
+658.706 bn
10.46%
1 ene 2009 año
7.956 billones
+997.946 bn
14.34%
1 ene 2010 año
8.302 billones
+346.032 bn
4.35%
1 ene 2011 año
9.5 billones
+1.198 billones
14.42%
1 ene 2012 año
10.966 billones
+1.467 billones
15.44%
1 ene 2013 año
11.769 billones
+802.091 bn
7.31%
1 ene 2014 año
11.754 billones
-14.752 bn
-0.13%
1 ene 2015 año
12.062 billones
+308.469 bn
2.62%
Ranking de los países por los datos estadísticos actuales


Comentarios: