29
/es/
es
AIzaSyAYiBZKx7MnpbEhh9jyipgxe19OcubqV5w
April 1, 2024
235147
Saudi Arabia
SAU
true
2
1
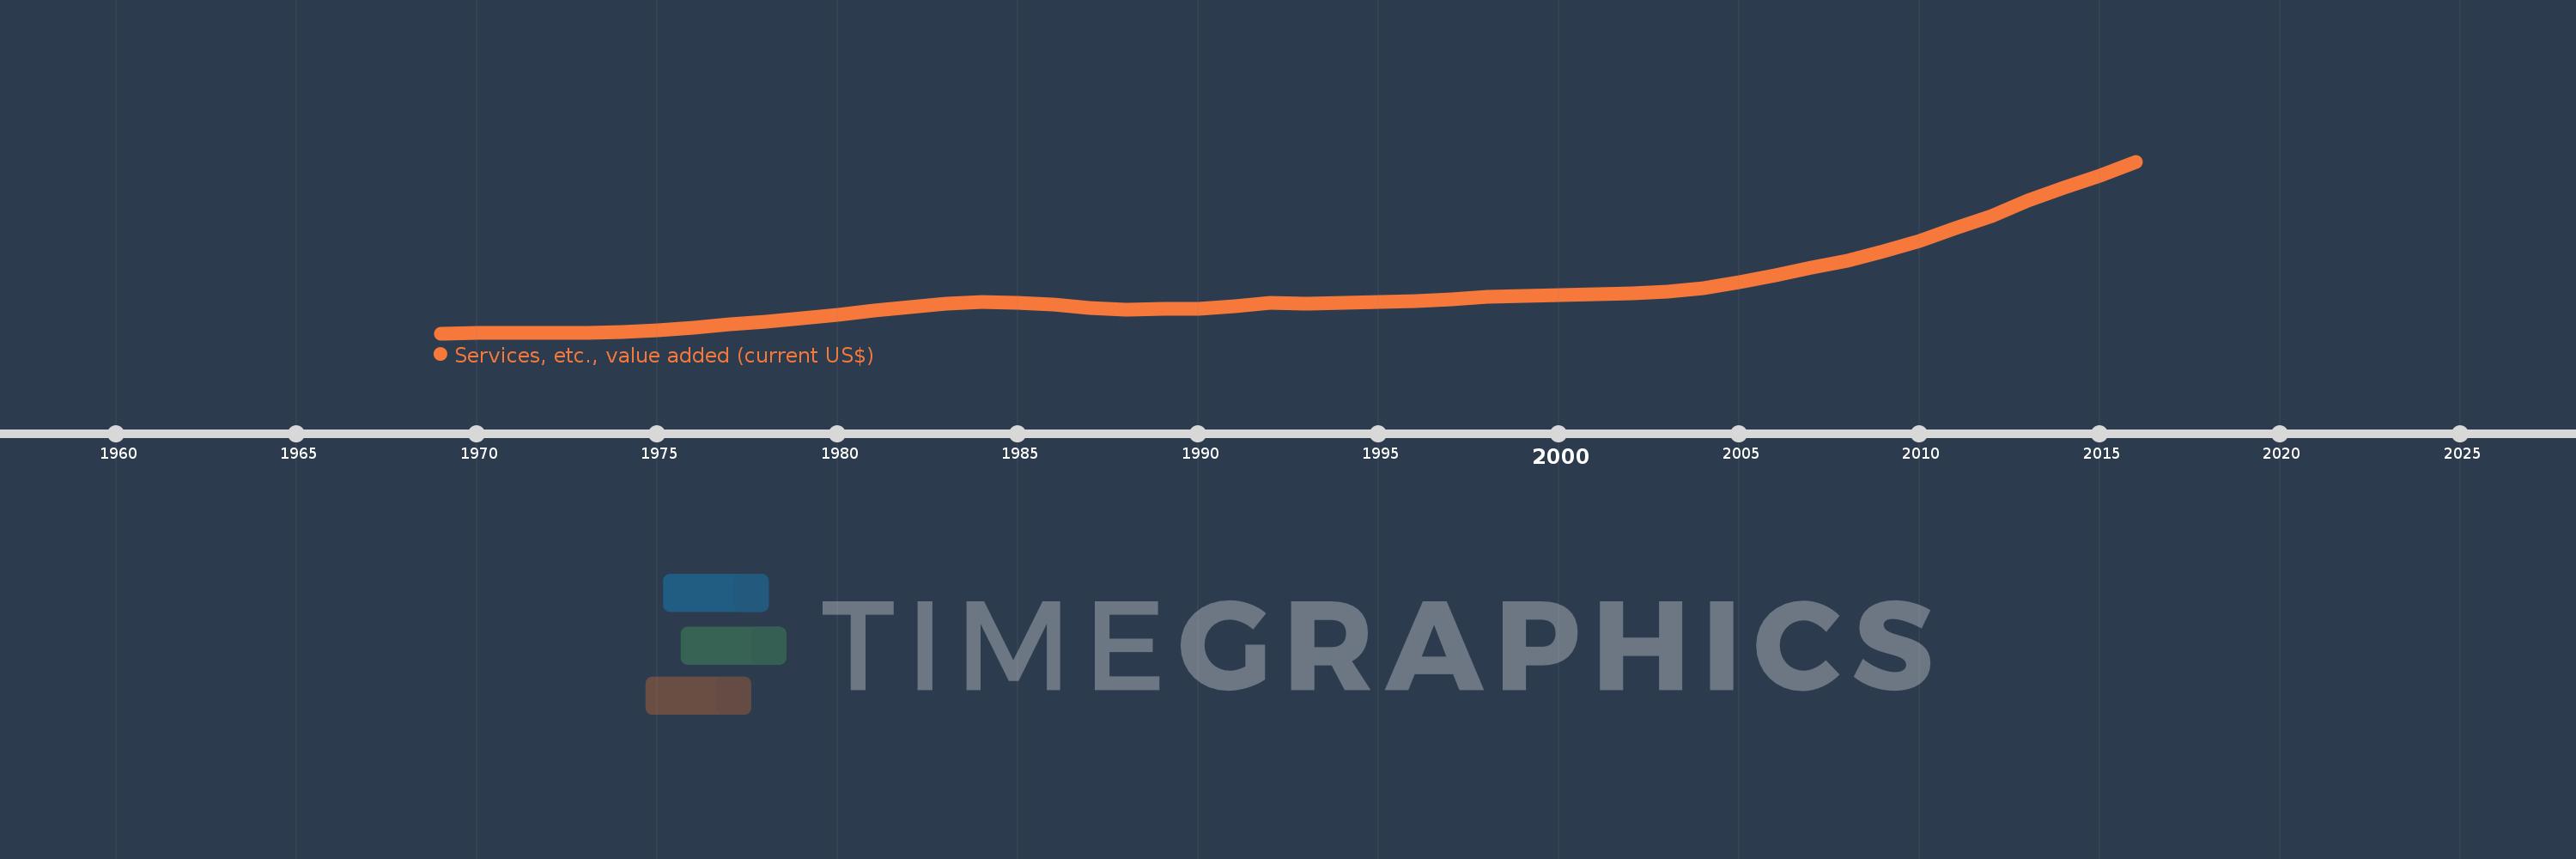
Services, etc., value added (current US$)
2016,2015,2014,2013,2012,2011,2010,2009,2008,2007,2006,2005,2004,2003,2002,2001,2000,1999,1998,1997,1996,1995,1994,1993,1992,1991,1990,1989,1988,1987,1986,1985,1984,1983,1982,1981,1980,1979,1978,1977,1976,1975,1974,1973,1972,1971,1970,1969
Estas estadísticas en otros países:
AfghanistanAlbaniaAlgeriaAndorraAngolaAntigua and BarbudaArab WorldArgentinaArmeniaArubaAustraliaAustriaAzerbaijanBahamas, TheBahrainBangladeshBarbadosBelarusBelgiumBelizeBeninBermudaBhutanBoliviaBosnia and HerzegovinaBotswanaBrazilBrunei DarussalamBulgariaBurkina FasoBurundiCabo VerdeCambodiaCameroonCanadaCaribbean small statesCentral African RepublicCentral Europe and the BalticsChadChileChinaColombiaComorosCongo, Dem. Rep.Congo, Rep.Costa RicaCote d'IvoireCroatiaCubaCyprusCzech RepublicDenmarkDjiboutiDominicaDominican RepublicEarly-demographic dividendEast Asia & PacificEast Asia & Pacific (excluding high income)East Asia & Pacific (IDA & IBRD countries)EcuadorEgypt, Arab Rep.El SalvadorEquatorial GuineaEritreaEstoniaEthiopiaEuro areaEurope & Central AsiaEurope & Central Asia (excluding high income)Europe & Central Asia (IDA & IBRD countries)European UnionFaroe IslandsFijiFinlandFragile and conflict affected situationsFranceGabonGambia, TheGeorgiaGermanyGhanaGreeceGrenadaGuatemalaGuineaGuinea-BissauGuyanaHeavily indebted poor countries (HIPC)High incomeHondurasHong Kong SAR, ChinaHungaryIBRD onlyIcelandIDA & IBRD totalIDA blendIDA onlyIDA totalIndiaIndonesiaIran, Islamic Rep.IraqIrelandItalyJamaicaJapanJordanKazakhstanKenyaKiribatiKorea, Rep.KosovoKuwaitKyrgyz RepublicLao PDRLate-demographic dividendLatin America & Caribbean Latin America & Caribbean (excluding high income)Latin America & the Caribbean (IDA & IBRD countries)LatviaLeast developed countries: UN classificationLebanonLesothoLiberiaLibyaLithuaniaLow & middle incomeLow incomeLower middle incomeLuxembourgMacao SAR, ChinaMacedonia, FYRMadagascarMalawiMalaysiaMaldivesMaliMaltaMarshall IslandsMauritaniaMauritiusMexicoMicronesia, Fed. Sts.Middle East & North AfricaMiddle East & North Africa (excluding high income)Middle East & North Africa (IDA & IBRD countries)Middle incomeMoldovaMongoliaMontenegroMoroccoMozambiqueMyanmarNamibiaNepalNetherlandsNew CaledoniaNew ZealandNicaraguaNigerNigeriaNorth AmericaNorwayOECD membersOmanOther small statesPacific island small statesPakistanPalauPanamaPapua New GuineaParaguayPeruPhilippinesPolandPortugalPost-demographic dividendPre-demographic dividendPuerto RicoQatarRomaniaRussian FederationRwandaSamoaSao Tome and PrincipeSaudi ArabiaSenegalSerbiaSeychellesSierra LeoneSingaporeSlovak RepublicSloveniaSmall statesSolomon IslandsSouth AfricaSouth AsiaSouth Asia (IDA & IBRD)SpainSri LankaSt. Kitts and NevisSt. LuciaSt. Vincent and the GrenadinesSub-Saharan Africa Sub-Saharan Africa (excluding high income)Sub-Saharan Africa (IDA & IBRD countries)SudanSurinameSwazilandSwedenSwitzerlandSyrian Arab RepublicTajikistanTanzaniaThailandTimor-LesteTogoTongaTrinidad and TobagoTunisiaTurkeyTurkmenistanTuvaluUgandaUkraineUnited Arab EmiratesUnited KingdomUnited StatesUpper middle incomeUruguayUzbekistanVanuatuVenezuela, RBVietnamWest Bank and GazaWorldYemen, Rep.ZambiaZimbabwe línea de tiempo (timeline):
En esta escala de tiempo se presenta un gráfico de 1969 y 2016 de Saudi Arabia. Los datos de 1968 están ausentes. El número de observaciones reales por fecha: 48.
Fuente (nombre):
Indicadores del desarrollo mundial
Fuente (organización):
World Bank national accounts data, and OECD National Accounts data files.
Categorías:
Economy & Growth
Se ha actualizado:
23 abr 2017 año
Los indicadores de los cambios de valor en los últimos años
Mínimo:
1.383 bn
1 ene 1969 año
Máximo:
334.874 bn
1 ene 2016 año
A la fecha de observación
Valor
Cambio absoluto
El cambio con respecto al valor anterior
1 ene 1969 año
1.383 bn
+1.383 bn
0.0%
1 ene 1970 año
1.524 bn
+140.889 millones
10.19%
1 ene 1971 año
2.012 bn
+487.778 millones
32.01%
1 ene 1972 año
2.249 bn
+237.709 millones
11.82%
1 ene 1973 año
2.884 bn
+634.831 millones
28.22%
1 ene 1974 año
4.194 bn
+1.31 bn
45.41%
1 ene 1975 año
7.283 bn
+3.089 bn
73.65%
1 ene 1976 año
12.733 bn
+5.451 bn
74.84%
1 ene 1977 año
18.342 bn
+5.609 bn
44.05%
1 ene 1978 año
23.576 bn
+5.234 bn
28.53%
1 ene 1979 año
30.699 bn
+7.123 bn
30.21%
1 ene 1980 año
37.917 bn
+7.218 bn
23.51%
1 ene 1981 año
45.281 bn
+7.364 bn
19.42%
1 ene 1982 año
52.039 bn
+6.759 bn
14.93%
1 ene 1983 año
59.163 bn
+7.124 bn
13.69%
1 ene 1984 año
62.543 bn
+3.38 bn
5.71%
1 ene 1985 año
61.182 bn
-1.361 bn
-2.18%
1 ene 1986 año
57.037 bn
-4.145 bn
-6.77%
1 ene 1987 año
49.789 bn
-7.248 bn
-12.71%
1 ene 1988 año
46.408 bn
-3.381 bn
-6.79%
1 ene 1989 año
48.652 bn
+2.244 bn
4.83%
1 ene 1990 año
48.867 bn
+215.487 millones
0.44%
1 ene 1991 año
53.094 bn
+4.227 bn
8.65%
1 ene 1992 año
60.468 bn
+7.374 bn
13.89%
1 ene 1993 año
58.711 bn
-1.757 bn
-2.91%
1 ene 1994 año
61.148 bn
+2.437 bn
4.15%
1 ene 1995 año
62.232 bn
+1.084 bn
1.77%
1 ene 1996 año
64.429 bn
+2.196 bn
3.53%
1 ene 1997 año
67.314 bn
+2.885 bn
4.48%
1 ene 1998 año
72.704 bn
+5.39 bn
8.01%
1 ene 1999 año
73.23 bn
+525.994 millones
0.72%
1 ene 2000 año
75.512 bn
+2.281 bn
3.12%
1 ene 2001 año
77.535 bn
+2.023 bn
2.68%
1 ene 2002 año
79.738 bn
+2.203 bn
2.84%
1 ene 2003 año
81.873 bn
+2.134 bn
2.68%
1 ene 2004 año
88.216 bn
+6.343 bn
7.75%
1 ene 2005 año
100.713 bn
+12.497 bn
14.17%
1 ene 2006 año
113.858 bn
+13.146 bn
13.05%
1 ene 2007 año
128.803 bn
+14.944 bn
13.13%
1 ene 2008 año
142.24 bn
+13.437 bn
10.43%
1 ene 2009 año
160.755 bn
+18.515 bn
13.02%
1 ene 2010 año
180.761 bn
+20.006 bn
12.45%
1 ene 2011 año
205.872 bn
+25.111 bn
13.89%
1 ene 2012 año
229.243 bn
+23.371 bn
11.35%
1 ene 2013 año
259.281 bn
+30.038 bn
13.1%
1 ene 2014 año
283.578 bn
+24.298 bn
9.37%
1 ene 2015 año
307.057 bn
+23.479 bn
8.28%
1 ene 2016 año
334.874 bn
+27.817 bn
9.06%
Ranking de los países por los datos estadísticos actuales


Comentarios: