29
/es/
es
AIzaSyAYiBZKx7MnpbEhh9jyipgxe19OcubqV5w
April 1, 2024
253680
Sudan
SDN
true
2
1
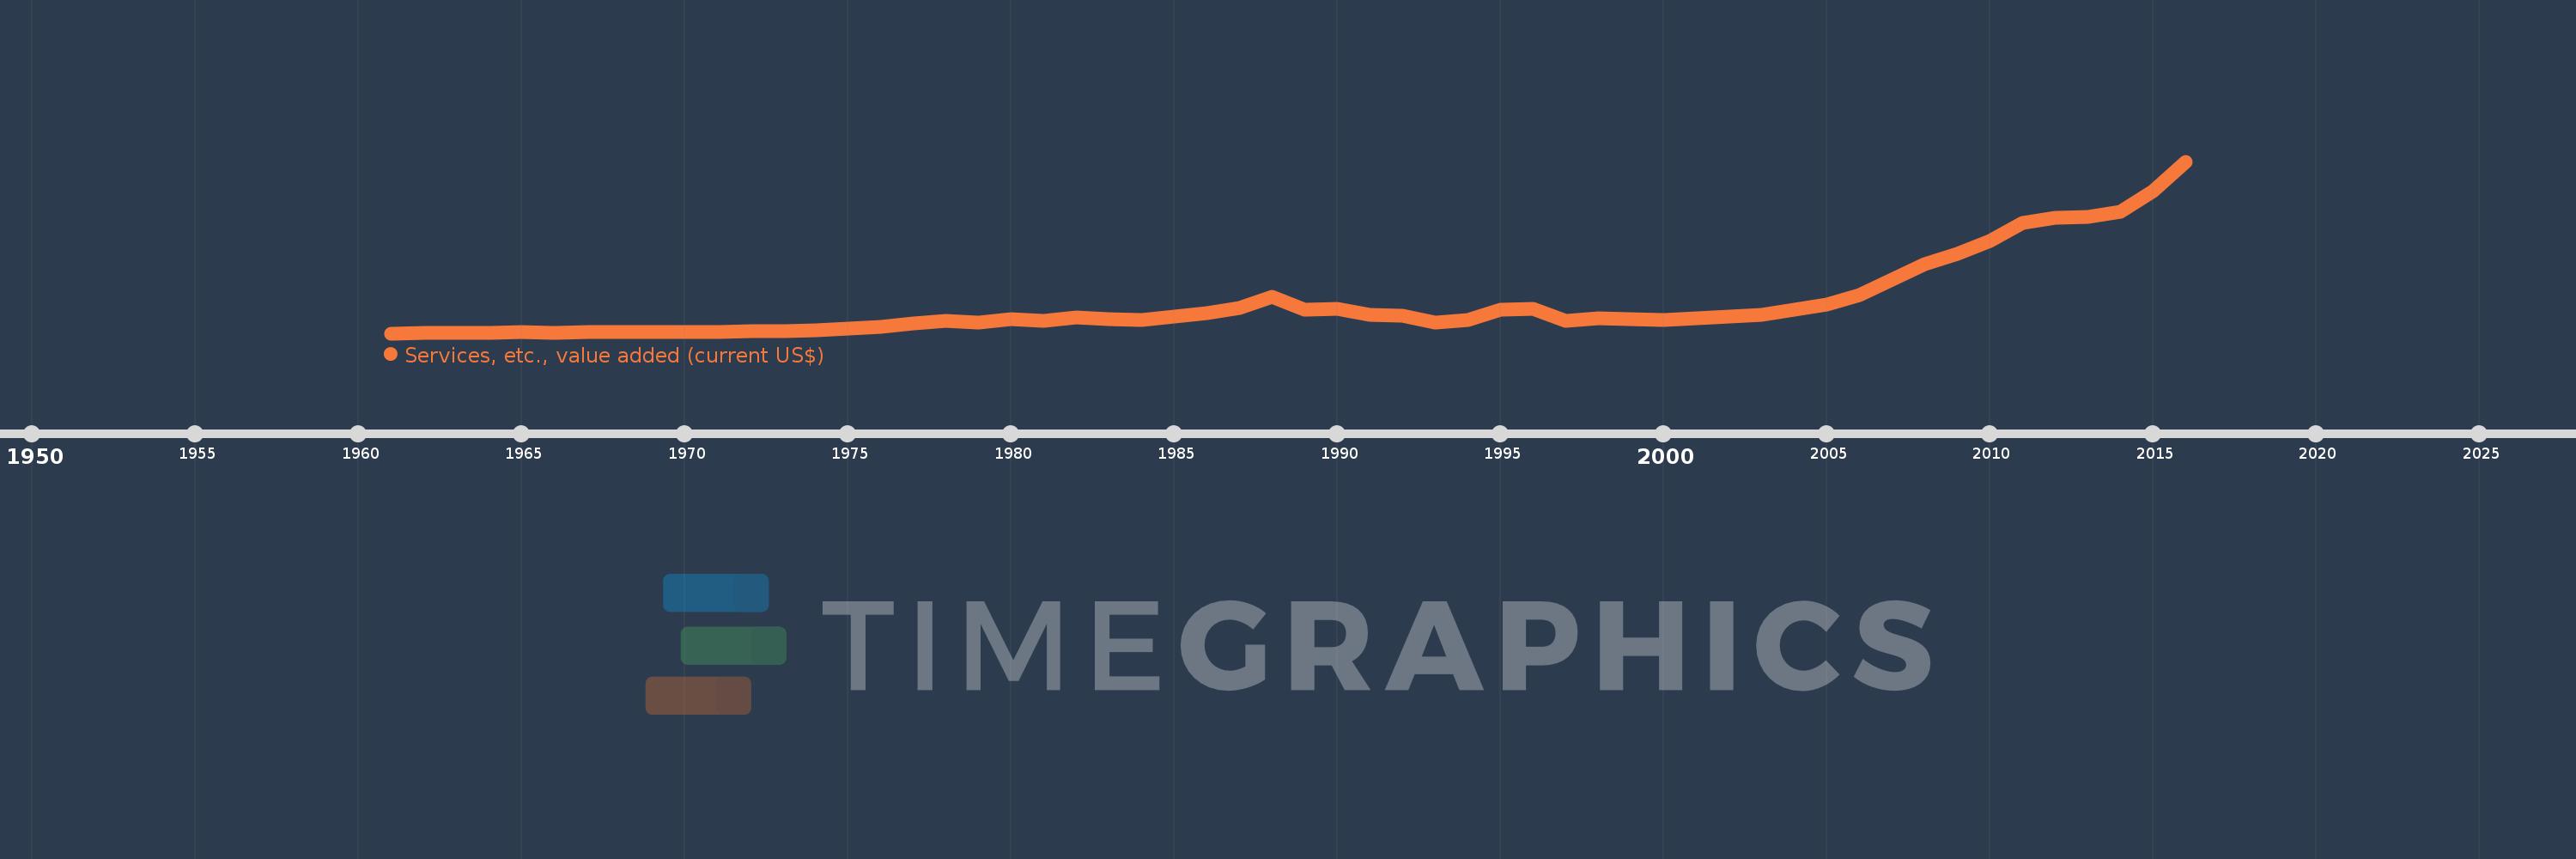
Services, etc., value added (current US$)
2016,2015,2014,2013,2012,2011,2010,2009,2008,2007,2006,2005,2004,2003,2002,2001,2000,1999,1998,1997,1996,1995,1994,1993,1992,1991,1990,1989,1988,1987,1986,1985,1984,1983,1982,1981,1980,1979,1978,1977,1976,1975,1974,1973,1972,1971,1970,1969,1968,1967,1966,1965,1964,1963,1962,1961
Estas estadísticas en otros países:
AfghanistanAlbaniaAlgeriaAndorraAngolaAntigua and BarbudaArab WorldArgentinaArmeniaArubaAustraliaAustriaAzerbaijanBahamas, TheBahrainBangladeshBarbadosBelarusBelgiumBelizeBeninBermudaBhutanBoliviaBosnia and HerzegovinaBotswanaBrazilBrunei DarussalamBulgariaBurkina FasoBurundiCabo VerdeCambodiaCameroonCanadaCaribbean small statesCentral African RepublicCentral Europe and the BalticsChadChileChinaColombiaComorosCongo, Dem. Rep.Congo, Rep.Costa RicaCote d'IvoireCroatiaCubaCyprusCzech RepublicDenmarkDjiboutiDominicaDominican RepublicEarly-demographic dividendEast Asia & PacificEast Asia & Pacific (excluding high income)East Asia & Pacific (IDA & IBRD countries)EcuadorEgypt, Arab Rep.El SalvadorEquatorial GuineaEritreaEstoniaEthiopiaEuro areaEurope & Central AsiaEurope & Central Asia (excluding high income)Europe & Central Asia (IDA & IBRD countries)European UnionFaroe IslandsFijiFinlandFragile and conflict affected situationsFranceGabonGambia, TheGeorgiaGermanyGhanaGreeceGrenadaGuatemalaGuineaGuinea-BissauGuyanaHeavily indebted poor countries (HIPC)High incomeHondurasHong Kong SAR, ChinaHungaryIBRD onlyIcelandIDA & IBRD totalIDA blendIDA onlyIDA totalIndiaIndonesiaIran, Islamic Rep.IraqIrelandItalyJamaicaJapanJordanKazakhstanKenyaKiribatiKorea, Rep.KosovoKuwaitKyrgyz RepublicLao PDRLate-demographic dividendLatin America & Caribbean Latin America & Caribbean (excluding high income)Latin America & the Caribbean (IDA & IBRD countries)LatviaLeast developed countries: UN classificationLebanonLesothoLiberiaLibyaLithuaniaLow & middle incomeLow incomeLower middle incomeLuxembourgMacao SAR, ChinaMacedonia, FYRMadagascarMalawiMalaysiaMaldivesMaliMaltaMarshall IslandsMauritaniaMauritiusMexicoMicronesia, Fed. Sts.Middle East & North AfricaMiddle East & North Africa (excluding high income)Middle East & North Africa (IDA & IBRD countries)Middle incomeMoldovaMongoliaMontenegroMoroccoMozambiqueMyanmarNamibiaNepalNetherlandsNew CaledoniaNew ZealandNicaraguaNigerNigeriaNorth AmericaNorwayOECD membersOmanOther small statesPacific island small statesPakistanPalauPanamaPapua New GuineaParaguayPeruPhilippinesPolandPortugalPost-demographic dividendPre-demographic dividendPuerto RicoQatarRomaniaRussian FederationRwandaSamoaSao Tome and PrincipeSaudi ArabiaSenegalSerbiaSeychellesSierra LeoneSingaporeSlovak RepublicSloveniaSmall statesSolomon IslandsSouth AfricaSouth AsiaSouth Asia (IDA & IBRD)SpainSri LankaSt. Kitts and NevisSt. LuciaSt. Vincent and the GrenadinesSub-Saharan Africa Sub-Saharan Africa (excluding high income)Sub-Saharan Africa (IDA & IBRD countries)SudanSurinameSwazilandSwedenSwitzerlandSyrian Arab RepublicTajikistanTanzaniaThailandTimor-LesteTogoTongaTrinidad and TobagoTunisiaTurkeyTurkmenistanTuvaluUgandaUkraineUnited Arab EmiratesUnited KingdomUnited StatesUpper middle incomeUruguayUzbekistanVanuatuVenezuela, RBVietnamWest Bank and GazaWorldYemen, Rep.ZambiaZimbabwe línea de tiempo (timeline):
En esta escala de tiempo se presenta un gráfico de 1961 y 2016 de Sudan. Los datos de 1960 están ausentes. El número de observaciones reales por fecha: 56.
Fuente (nombre):
Indicadores del desarrollo mundial
Fuente (organización):
World Bank national accounts data, and OECD National Accounts data files.
Categorías:
Economy & Growth
Se ha actualizado:
23 abr 2017 año
Los indicadores de los cambios de valor en los últimos años
Mínimo:
470.667 millones
1 ene 1961 año
Máximo:
45.084 bn
1 ene 2016 año
A la fecha de observación
Valor
Cambio absoluto
El cambio con respecto al valor anterior
1 ene 1961 año
470.667 millones
+470.667 millones
0.0%
1 ene 1962 año
520.667 millones
+50.0 millones
10.62%
1 ene 1963 año
593.0 millones
+72.333 millones
13.89%
1 ene 1964 año
663.0 millones
+70.0 millones
11.8%
1 ene 1965 año
728.333 millones
+65.333 millones
9.85%
1 ene 1966 año
626.667 millones
-101.667 millones
-13.96%
1 ene 1967 año
707.667 millones
+81.0 millones
12.93%
1 ene 1968 año
770.0 millones
+62.333 millones
8.81%
1 ene 1969 año
808.0 millones
+38.0 millones
4.94%
1 ene 1970 año
836.0 millones
+28.0 millones
3.47%
1 ene 1971 año
896.333 millones
+60.333 millones
7.22%
1 ene 1972 año
965.0 millones
+68.667 millones
7.66%
1 ene 1973 año
1.065 bn
+99.667 millones
10.33%
1 ene 1974 año
1.316 bn
+251.0 millones
23.58%
1 ene 1975 año
1.713 bn
+397.667 millones
30.23%
1 ene 1976 año
2.245 bn
+532.0 millones
31.05%
1 ene 1977 año
2.944 bn
+699.0 millones
31.13%
1 ene 1978 año
3.709 bn
+765.0 millones
25.98%
1 ene 1979 año
3.328 bn
-381.583 millones
-10.29%
1 ene 1980 año
4.173 bn
+845.25 millones
25.4%
1 ene 1981 año
3.6 bn
-572.833 millones
-13.73%
1 ene 1982 año
4.537 bn
+937.0 millones
26.03%
1 ene 1983 año
4.137 bn
-399.722 millones
-8.81%
1 ene 1984 año
3.879 bn
-258.291 millones
-6.24%
1 ene 1985 año
4.808 bn
+928.918 millones
23.95%
1 ene 1986 año
5.813 bn
+1.005 bn
20.89%
1 ene 1987 año
7.126 bn
+1.314 bn
22.6%
1 ene 1988 año
9.879 bn
+2.752 bn
38.62%
1 ene 1989 año
6.537 bn
-3.342 bn
-33.83%
1 ene 1990 año
6.77 bn
+233.437 millones
3.57%
1 ene 1991 año
5.27 bn
-1.501 bn
-22.16%
1 ene 1992 año
4.992 bn
-277.276 millones
-5.26%
1 ene 1993 año
3.199 bn
-1.793 bn
-35.92%
1 ene 1994 año
3.94 bn
+740.936 millones
23.16%
1 ene 1995 año
6.665 bn
+2.726 bn
69.18%
1 ene 1996 año
6.77 bn
+104.611 millones
1.57%
1 ene 1997 año
3.598 bn
-3.172 bn
-46.86%
1 ene 1998 año
4.342 bn
+743.951 millones
20.68%
1 ene 1999 año
4.143 bn
-198.672 millones
-4.58%
1 ene 2000 año
3.938 bn
-205.043 millones
-4.95%
1 ene 2001 año
4.377 bn
+439.07 millones
11.15%
1 ene 2002 año
4.865 bn
+488.312 millones
11.16%
1 ene 2003 año
5.35 bn
+484.598 millones
9.96%
1 ene 2004 año
6.654 bn
+1.304 bn
24.37%
1 ene 2005 año
7.922 bn
+1.268 bn
19.05%
1 ene 2006 año
10.498 bn
+2.577 bn
32.53%
1 ene 2007 año
14.337 bn
+3.839 bn
36.56%
1 ene 2008 año
18.497 bn
+4.16 bn
29.01%
1 ene 2009 año
21.123 bn
+2.626 bn
14.2%
1 ene 2010 año
24.554 bn
+3.431 bn
16.24%
1 ene 2011 año
29.191 bn
+4.637 bn
18.88%
1 ene 2012 año
30.436 bn
+1.245 bn
4.27%
1 ene 2013 año
30.726 bn
+289.784 millones
0.95%
1 ene 2014 año
32.038 bn
+1.312 bn
4.27%
1 ene 2015 año
37.346 bn
+5.308 bn
16.57%
1 ene 2016 año
45.084 bn
+7.738 bn
20.72%
Ranking de los países por los datos estadísticos actuales


Comentarios: