29
/es/
es
AIzaSyAYiBZKx7MnpbEhh9jyipgxe19OcubqV5w
April 1, 2024
38122
IDA blend
IDB
false
2
1
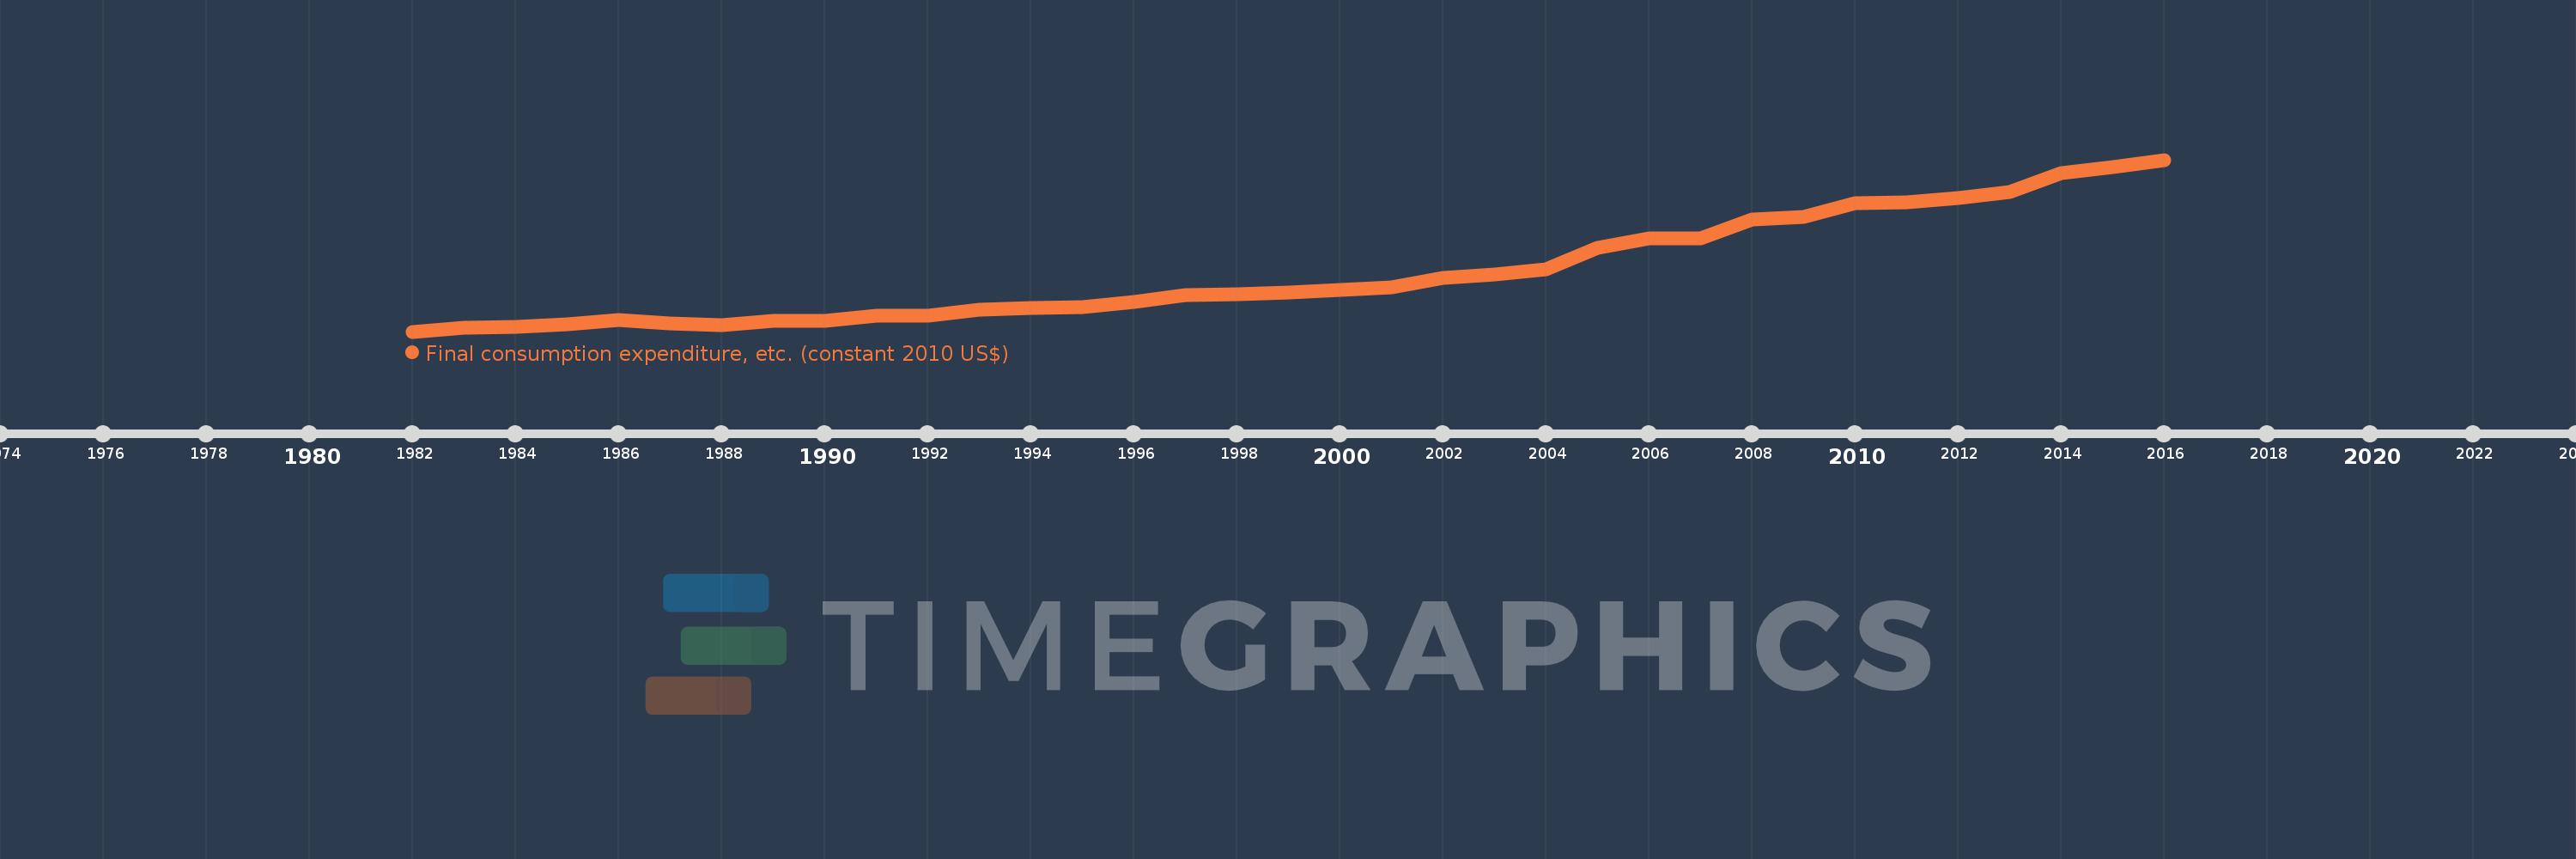
Final consumption expenditure, etc. (constant 2010 US$)
2016,2015,2014,2013,2012,2011,2010,2009,2008,2007,2006,2005,2004,2003,2002,2001,2000,1999,1998,1997,1996,1995,1994,1993,1992,1991,1990,1989,1988,1987,1986,1985,1984,1983,1982
Estas estadísticas en otros países:
AfghanistanAlbaniaAlgeriaAngolaAntigua and BarbudaArab WorldArgentinaArmeniaArubaAustraliaAustriaAzerbaijanBahamas, TheBahrainBangladeshBarbadosBelarusBelgiumBelizeBeninBermudaBhutanBoliviaBosnia and HerzegovinaBotswanaBrazilBrunei DarussalamBulgariaBurkina FasoBurundiCabo VerdeCambodiaCameroonCanadaCaribbean small statesCentral African RepublicCentral Europe and the BalticsChadChileChinaColombiaComorosCongo, Dem. Rep.Congo, Rep.Cote d'IvoireCroatiaCubaCyprusCzech RepublicDenmarkDominicaDominican RepublicEarly-demographic dividendEast Asia & PacificEast Asia & Pacific (excluding high income)East Asia & Pacific (IDA & IBRD countries)EcuadorEgypt, Arab Rep.El SalvadorEquatorial GuineaEritreaEstoniaEuro areaEurope & Central AsiaEurope & Central Asia (excluding high income)Europe & Central Asia (IDA & IBRD countries)European UnionFaroe IslandsFinlandFragile and conflict affected situationsFranceGabonGambia, TheGeorgiaGermanyGhanaGreeceGrenadaGuatemalaGuineaGuinea-BissauGuyanaHaitiHeavily indebted poor countries (HIPC)High incomeHondurasHong Kong SAR, ChinaHungaryIBRD onlyIcelandIDA & IBRD totalIDA blendIDA onlyIDA totalIndiaIndonesiaIran, Islamic Rep.IraqIrelandIsraelItalyJamaicaJapanJordanKazakhstanKenyaKorea, Rep.KosovoKuwaitKyrgyz RepublicLao PDRLate-demographic dividendLatin America & Caribbean Latin America & Caribbean (excluding high income)Latin America & the Caribbean (IDA & IBRD countries)LatviaLeast developed countries: UN classificationLebanonLiberiaLithuaniaLow & middle incomeLow incomeLower middle incomeLuxembourgMacao SAR, ChinaMacedonia, FYRMadagascarMalawiMalaysiaMaliMaltaMauritaniaMauritiusMexicoMiddle East & North AfricaMiddle East & North Africa (excluding high income)Middle East & North Africa (IDA & IBRD countries)Middle incomeMoldovaMongoliaMontenegroMoroccoMozambiqueNamibiaNepalNetherlandsNew ZealandNicaraguaNigerNigeriaNorth AmericaNorwayOECD membersOmanOther small statesPakistanPanamaParaguayPeruPhilippinesPolandPortugalPost-demographic dividendPre-demographic dividendPuerto RicoQatarRomaniaRussian FederationRwandaSaudi ArabiaSenegalSerbiaSeychellesSierra LeoneSingaporeSlovak RepublicSloveniaSmall statesSouth AfricaSouth AsiaSouth Asia (IDA & IBRD)South SudanSpainSri LankaSt. Kitts and NevisSt. LuciaSt. Vincent and the GrenadinesSub-Saharan Africa Sub-Saharan Africa (excluding high income)Sub-Saharan Africa (IDA & IBRD countries)SudanSurinameSwazilandSwedenSwitzerlandTajikistanTanzaniaThailandTimor-LesteTogoTongaTrinidad and TobagoTunisiaTurkeyTurkmenistanUgandaUkraineUnited Arab EmiratesUnited KingdomUnited StatesUpper middle incomeUruguayUzbekistanVanuatuVenezuela, RBVietnamWest Bank and GazaWorldYemen, Rep.ZambiaZimbabwe línea de tiempo (timeline):
En esta escala de tiempo se presenta un gráfico de 1982 y 2016 de IDA blend. Los datos de 1981 están ausentes. El número de observaciones reales por fecha: 35.
Fuente (nombre):
Indicadores del desarrollo mundial
Fuente (organización):
World Bank national accounts data, and OECD National Accounts data files.
Categorías:
Economy & Growth
Se ha actualizado:
23 abr 2017 año
Los indicadores de los cambios de valor en los últimos años
Mínimo:
193.126 bn
1 ene 1982 año
Máximo:
825.444 bn
1 ene 2016 año
A la fecha de observación
Valor
Cambio absoluto
El cambio con respecto al valor anterior
1 ene 1982 año
193.126 bn
+193.126 bn
0.0%
1 ene 1983 año
207.064 bn
+13.938 bn
7.22%
1 ene 1984 año
211.883 bn
+4.819 bn
2.33%
1 ene 1985 año
220.204 bn
+8.321 bn
3.93%
1 ene 1986 año
236.639 bn
+16.435 bn
7.46%
1 ene 1987 año
224.701 bn
-11.938 bn
-5.04%
1 ene 1988 año
216.172 bn
-8.53 bn
-3.8%
1 ene 1989 año
233.246 bn
+17.074 bn
7.9%
1 ene 1990 año
233.751 bn
+505.244 millones
0.22%
1 ene 1991 año
252.505 bn
+18.754 bn
8.02%
1 ene 1992 año
252.746 bn
+241.2 millones
0.1%
1 ene 1993 año
273.321 bn
+20.575 bn
8.14%
1 ene 1994 año
279.357 bn
+6.036 bn
2.21%
1 ene 1995 año
284.482 bn
+5.125 bn
1.83%
1 ene 1996 año
302.284 bn
+17.802 bn
6.26%
1 ene 1997 año
328.025 bn
+25.741 bn
8.52%
1 ene 1998 año
329.178 bn
+1.154 bn
0.35%
1 ene 1999 año
337.888 bn
+8.709 bn
2.65%
1 ene 2000 año
347.144 bn
+9.257 bn
2.74%
1 ene 2001 año
355.648 bn
+8.504 bn
2.45%
1 ene 2002 año
391.207 bn
+35.559 bn
10.0%
1 ene 2003 año
402.558 bn
+11.351 bn
2.9%
1 ene 2004 año
422.19 bn
+19.632 bn
4.88%
1 ene 2005 año
501.491 bn
+79.301 bn
18.78%
1 ene 2006 año
536.1 bn
+34.608 bn
6.9%
1 ene 2007 año
537.005 bn
+905.522 millones
0.17%
1 ene 2008 año
606.76 bn
+69.754 bn
12.99%
1 ene 2009 año
615.438 bn
+8.678 bn
1.43%
1 ene 2010 año
664.791 bn
+49.353 bn
8.02%
1 ene 2011 año
668.913 bn
+4.122 bn
0.62%
1 ene 2012 año
685.874 bn
+16.96 bn
2.54%
1 ene 2013 año
708.371 bn
+22.497 bn
3.28%
1 ene 2014 año
775.496 bn
+67.126 bn
9.48%
1 ene 2015 año
799.328 bn
+23.831 bn
3.07%
1 ene 2016 año
825.444 bn
+26.117 bn
3.27%
Ranking de los países por los datos estadísticos actuales


Comentarios: