29
/es/
es
AIzaSyAYiBZKx7MnpbEhh9jyipgxe19OcubqV5w
April 1, 2024
123453
Ecuador
ECU
true
2
1
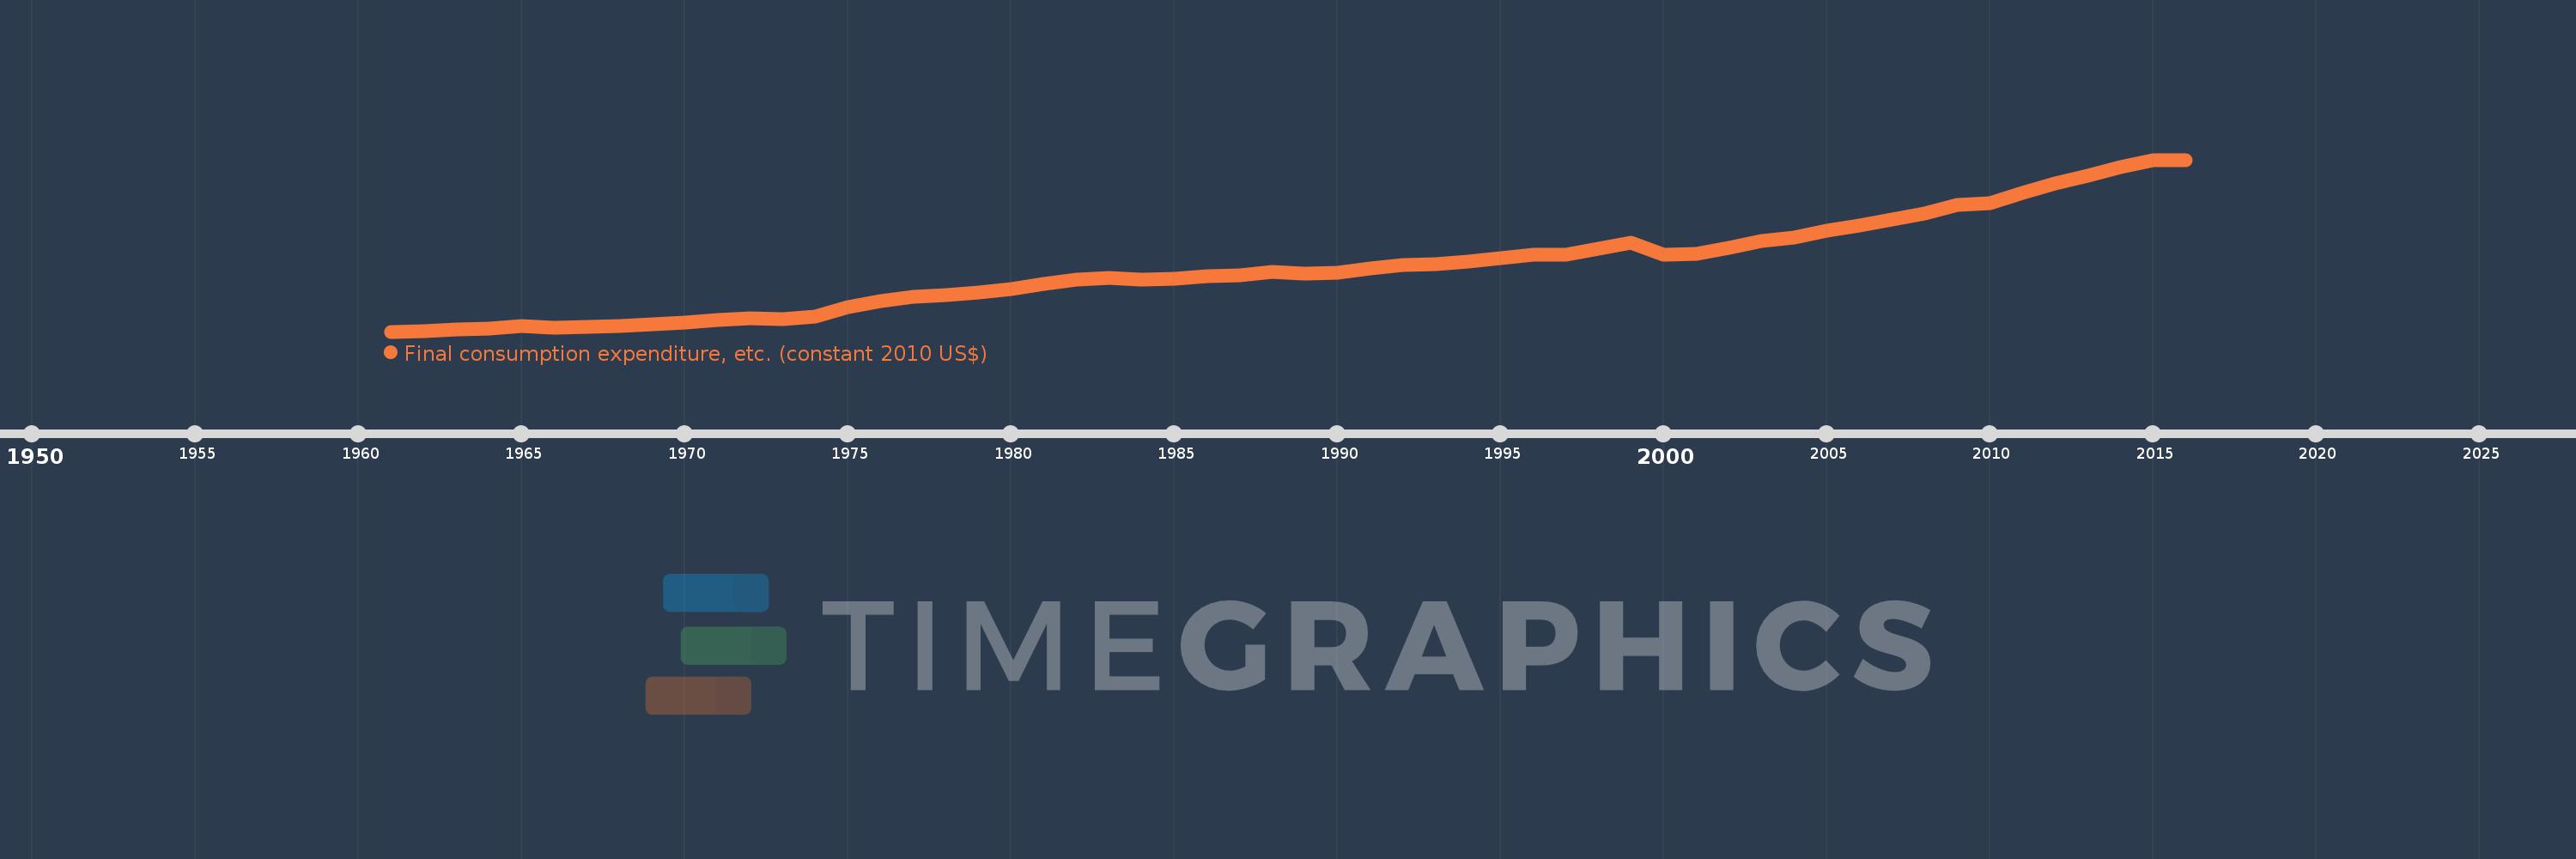
Final consumption expenditure, etc. (constant 2010 US$)
2016,2015,2014,2013,2012,2011,2010,2009,2008,2007,2006,2005,2004,2003,2002,2001,2000,1999,1998,1997,1996,1995,1994,1993,1992,1991,1990,1989,1988,1987,1986,1985,1984,1983,1982,1981,1980,1979,1978,1977,1976,1975,1974,1973,1972,1971,1970,1969,1968,1967,1966,1965,1964,1963,1962,1961
Estas estadísticas en otros países:
AfghanistanAlbaniaAlgeriaAngolaAntigua and BarbudaArab WorldArgentinaArmeniaArubaAustraliaAustriaAzerbaijanBahamas, TheBahrainBangladeshBarbadosBelarusBelgiumBelizeBeninBermudaBhutanBoliviaBosnia and HerzegovinaBotswanaBrazilBrunei DarussalamBulgariaBurkina FasoBurundiCabo VerdeCambodiaCameroonCanadaCaribbean small statesCentral African RepublicCentral Europe and the BalticsChadChileChinaColombiaComorosCongo, Dem. Rep.Congo, Rep.Cote d'IvoireCroatiaCubaCyprusCzech RepublicDenmarkDominicaDominican RepublicEarly-demographic dividendEast Asia & PacificEast Asia & Pacific (excluding high income)East Asia & Pacific (IDA & IBRD countries)EcuadorEgypt, Arab Rep.El SalvadorEquatorial GuineaEritreaEstoniaEuro areaEurope & Central AsiaEurope & Central Asia (excluding high income)Europe & Central Asia (IDA & IBRD countries)European UnionFaroe IslandsFinlandFragile and conflict affected situationsFranceGabonGambia, TheGeorgiaGermanyGhanaGreeceGrenadaGuatemalaGuineaGuinea-BissauGuyanaHaitiHeavily indebted poor countries (HIPC)High incomeHondurasHong Kong SAR, ChinaHungaryIBRD onlyIcelandIDA & IBRD totalIDA blendIDA onlyIDA totalIndiaIndonesiaIran, Islamic Rep.IraqIrelandIsraelItalyJamaicaJapanJordanKazakhstanKenyaKorea, Rep.KosovoKuwaitKyrgyz RepublicLao PDRLate-demographic dividendLatin America & Caribbean Latin America & Caribbean (excluding high income)Latin America & the Caribbean (IDA & IBRD countries)LatviaLeast developed countries: UN classificationLebanonLiberiaLithuaniaLow & middle incomeLow incomeLower middle incomeLuxembourgMacao SAR, ChinaMacedonia, FYRMadagascarMalawiMalaysiaMaliMaltaMauritaniaMauritiusMexicoMiddle East & North AfricaMiddle East & North Africa (excluding high income)Middle East & North Africa (IDA & IBRD countries)Middle incomeMoldovaMongoliaMontenegroMoroccoMozambiqueNamibiaNepalNetherlandsNew ZealandNicaraguaNigerNigeriaNorth AmericaNorwayOECD membersOmanOther small statesPakistanPanamaParaguayPeruPhilippinesPolandPortugalPost-demographic dividendPre-demographic dividendPuerto RicoQatarRomaniaRussian FederationRwandaSaudi ArabiaSenegalSerbiaSeychellesSierra LeoneSingaporeSlovak RepublicSloveniaSmall statesSouth AfricaSouth AsiaSouth Asia (IDA & IBRD)South SudanSpainSri LankaSt. Kitts and NevisSt. LuciaSt. Vincent and the GrenadinesSub-Saharan Africa Sub-Saharan Africa (excluding high income)Sub-Saharan Africa (IDA & IBRD countries)SudanSurinameSwazilandSwedenSwitzerlandTajikistanTanzaniaThailandTimor-LesteTogoTongaTrinidad and TobagoTunisiaTurkeyTurkmenistanUgandaUkraineUnited Arab EmiratesUnited KingdomUnited StatesUpper middle incomeUruguayUzbekistanVanuatuVenezuela, RBVietnamWest Bank and GazaWorldYemen, Rep.ZambiaZimbabwe línea de tiempo (timeline):
En esta escala de tiempo se presenta un gráfico de 1961 y 2016 de Ecuador. Los datos de 1960 están ausentes. El número de observaciones reales por fecha: 56.
Fuente (nombre):
Indicadores del desarrollo mundial
Fuente (organización):
World Bank national accounts data, and OECD National Accounts data files.
Categorías:
Economy & Growth
Se ha actualizado:
23 abr 2017 año
Los indicadores de los cambios de valor en los últimos años
Mínimo:
7.883 bn
1 ene 1961 año
Máximo:
63.888 bn
1 ene 2015 año
A la fecha de observación
Valor
Cambio absoluto
El cambio con respecto al valor anterior
1 ene 1961 año
7.883 bn
+7.883 bn
0.0%
1 ene 1962 año
8.084 bn
+201.233 millones
2.55%
1 ene 1963 año
8.593 bn
+509.031 millones
6.3%
1 ene 1964 año
8.895 bn
+301.911 millones
3.51%
1 ene 1965 año
9.758 bn
+863.145 millones
9.7%
1 ene 1966 año
9.264 bn
-493.858 millones
-5.06%
1 ene 1967 año
9.337 bn
+72.187 millones
0.78%
1 ene 1968 año
9.685 bn
+348.571 millones
3.73%
1 ene 1969 año
10.171 bn
+486.162 millones
5.02%
1 ene 1970 año
10.773 bn
+601.831 millones
5.92%
1 ene 1971 año
11.614 bn
+841.134 millones
7.81%
1 ene 1972 año
12.143 bn
+529.04 millones
4.56%
1 ene 1973 año
11.959 bn
-184.236 millones
-1.52%
1 ene 1974 año
12.703 bn
+743.661 millones
6.22%
1 ene 1975 año
15.786 bn
+3.084 bn
24.27%
1 ene 1976 año
17.69 bn
+1.904 bn
12.06%
1 ene 1977 año
19.086 bn
+1.396 bn
7.89%
1 ene 1978 año
19.82 bn
+734.147 millones
3.85%
1 ene 1979 año
20.503 bn
+682.656 millones
3.44%
1 ene 1980 año
21.814 bn
+1.311 bn
6.39%
1 ene 1981 año
23.337 bn
+1.523 bn
6.98%
1 ene 1982 año
24.749 bn
+1.412 bn
6.05%
1 ene 1983 año
25.411 bn
+661.732 millones
2.67%
1 ene 1984 año
24.816 bn
-595.217 millones
-2.34%
1 ene 1985 año
25.211 bn
+395.244 millones
1.59%
1 ene 1986 año
26.036 bn
+825.393 millones
3.27%
1 ene 1987 año
26.112 bn
+75.732 millones
0.29%
1 ene 1988 año
27.383 bn
+1.271 bn
4.87%
1 ene 1989 año
26.739 bn
-643.711 millones
-2.35%
1 ene 1990 año
27.168 bn
+429.149 millones
1.6%
1 ene 1991 año
28.464 bn
+1.296 bn
4.77%
1 ene 1992 año
29.498 bn
+1.033 bn
3.63%
1 ene 1993 año
29.788 bn
+290.73 millones
0.99%
1 ene 1994 año
30.665 bn
+876.835 millones
2.94%
1 ene 1995 año
31.783 bn
+1.118 bn
3.65%
1 ene 1996 año
32.808 bn
+1.025 bn
3.23%
1 ene 1997 año
32.908 bn
+99.927 millones
0.3%
1 ene 1998 año
34.929 bn
+2.021 bn
6.14%
1 ene 1999 año
36.811 bn
+1.882 bn
5.39%
1 ene 2000 año
32.839 bn
-3.972 bn
-10.79%
1 ene 2001 año
33.275 bn
+436.483 millones
1.33%
1 ene 2002 año
35.159 bn
+1.884 bn
5.66%
1 ene 2003 año
37.391 bn
+2.233 bn
6.35%
1 ene 2004 año
38.411 bn
+1.02 bn
2.73%
1 ene 2005 año
40.773 bn
+2.362 bn
6.15%
1 ene 2006 año
42.527 bn
+1.754 bn
4.3%
1 ene 2007 año
44.344 bn
+1.817 bn
4.27%
1 ene 2008 año
46.315 bn
+1.97 bn
4.44%
1 ene 2009 año
49.194 bn
+2.879 bn
6.22%
1 ene 2010 año
49.639 bn
+444.863 millones
0.9%
1 ene 2011 año
53.193 bn
+3.554 bn
7.16%
1 ene 2012 año
56.229 bn
+3.036 bn
5.71%
1 ene 2013 año
58.616 bn
+2.387 bn
4.25%
1 ene 2014 año
61.576 bn
+2.96 bn
5.05%
1 ene 2015 año
63.888 bn
+2.312 bn
3.75%
1 ene 2016 año
63.885 bn
-2.591 millones
0.0%
Ranking de los países por los datos estadísticos actuales


Comentarios: