29
/es/
es
AIzaSyAYiBZKx7MnpbEhh9jyipgxe19OcubqV5w
April 1, 2024
240421
Singapore
SGP
true
2
1
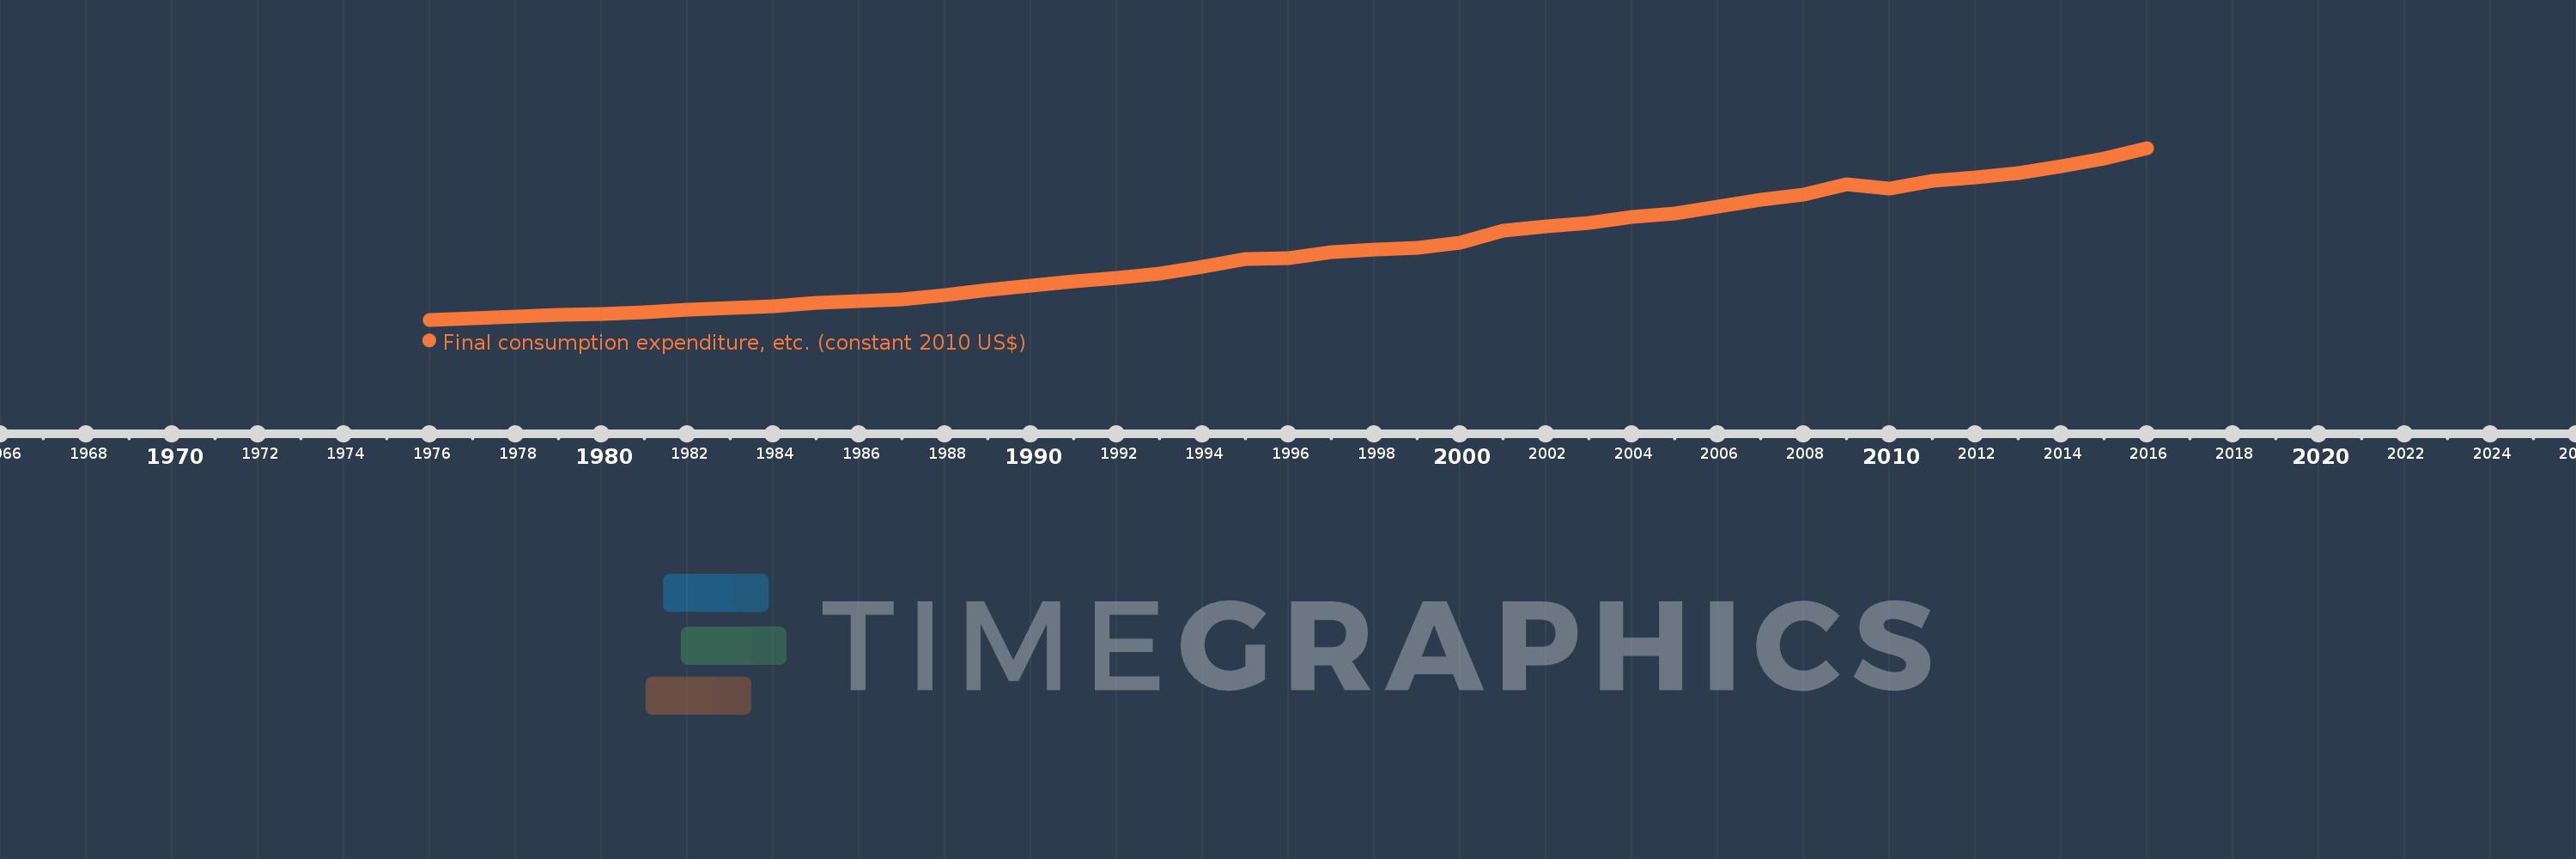
Final consumption expenditure, etc. (constant 2010 US$)
2016,2015,2014,2013,2012,2011,2010,2009,2008,2007,2006,2005,2004,2003,2002,2001,2000,1999,1998,1997,1996,1995,1994,1993,1992,1991,1990,1989,1988,1987,1986,1985,1984,1983,1982,1981,1980,1979,1978,1977,1976
Estas estadísticas en otros países:
AfghanistanAlbaniaAlgeriaAngolaAntigua and BarbudaArab WorldArgentinaArmeniaArubaAustraliaAustriaAzerbaijanBahamas, TheBahrainBangladeshBarbadosBelarusBelgiumBelizeBeninBermudaBhutanBoliviaBosnia and HerzegovinaBotswanaBrazilBrunei DarussalamBulgariaBurkina FasoBurundiCabo VerdeCambodiaCameroonCanadaCaribbean small statesCentral African RepublicCentral Europe and the BalticsChadChileChinaColombiaComorosCongo, Dem. Rep.Congo, Rep.Cote d'IvoireCroatiaCubaCyprusCzech RepublicDenmarkDominicaDominican RepublicEarly-demographic dividendEast Asia & PacificEast Asia & Pacific (excluding high income)East Asia & Pacific (IDA & IBRD countries)EcuadorEgypt, Arab Rep.El SalvadorEquatorial GuineaEritreaEstoniaEuro areaEurope & Central AsiaEurope & Central Asia (excluding high income)Europe & Central Asia (IDA & IBRD countries)European UnionFaroe IslandsFinlandFragile and conflict affected situationsFranceGabonGambia, TheGeorgiaGermanyGhanaGreeceGrenadaGuatemalaGuineaGuinea-BissauGuyanaHaitiHeavily indebted poor countries (HIPC)High incomeHondurasHong Kong SAR, ChinaHungaryIBRD onlyIcelandIDA & IBRD totalIDA blendIDA onlyIDA totalIndiaIndonesiaIran, Islamic Rep.IraqIrelandIsraelItalyJamaicaJapanJordanKazakhstanKenyaKorea, Rep.KosovoKuwaitKyrgyz RepublicLao PDRLate-demographic dividendLatin America & Caribbean Latin America & Caribbean (excluding high income)Latin America & the Caribbean (IDA & IBRD countries)LatviaLeast developed countries: UN classificationLebanonLiberiaLithuaniaLow & middle incomeLow incomeLower middle incomeLuxembourgMacao SAR, ChinaMacedonia, FYRMadagascarMalawiMalaysiaMaliMaltaMauritaniaMauritiusMexicoMiddle East & North AfricaMiddle East & North Africa (excluding high income)Middle East & North Africa (IDA & IBRD countries)Middle incomeMoldovaMongoliaMontenegroMoroccoMozambiqueNamibiaNepalNetherlandsNew ZealandNicaraguaNigerNigeriaNorth AmericaNorwayOECD membersOmanOther small statesPakistanPanamaParaguayPeruPhilippinesPolandPortugalPost-demographic dividendPre-demographic dividendPuerto RicoQatarRomaniaRussian FederationRwandaSaudi ArabiaSenegalSerbiaSeychellesSierra LeoneSingaporeSlovak RepublicSloveniaSmall statesSouth AfricaSouth AsiaSouth Asia (IDA & IBRD)South SudanSpainSri LankaSt. Kitts and NevisSt. LuciaSt. Vincent and the GrenadinesSub-Saharan Africa Sub-Saharan Africa (excluding high income)Sub-Saharan Africa (IDA & IBRD countries)SudanSurinameSwazilandSwedenSwitzerlandTajikistanTanzaniaThailandTimor-LesteTogoTongaTrinidad and TobagoTunisiaTurkeyTurkmenistanUgandaUkraineUnited Arab EmiratesUnited KingdomUnited StatesUpper middle incomeUruguayUzbekistanVanuatuVenezuela, RBVietnamWest Bank and GazaWorldYemen, Rep.ZambiaZimbabwe línea de tiempo (timeline):
En esta escala de tiempo se presenta un gráfico de 1976 y 2016 de Singapore. Los datos de 1975 están ausentes. El número de observaciones reales por fecha: 41.
Fuente (nombre):
Indicadores del desarrollo mundial
Fuente (organización):
World Bank national accounts data, and OECD National Accounts data files.
Categorías:
Economy & Growth
Se ha actualizado:
23 abr 2017 año
Los indicadores de los cambios de valor en los últimos años
Mínimo:
12.239 bn
1 ene 1976 año
Máximo:
130.682 bn
1 ene 2016 año
A la fecha de observación
Valor
Cambio absoluto
El cambio con respecto al valor anterior
1 ene 1976 año
12.239 bn
+12.239 bn
0.0%
1 ene 1977 año
13.139 bn
+899.45 millones
7.35%
1 ene 1978 año
14.562 bn
+1.424 bn
10.84%
1 ene 1979 año
15.679 bn
+1.116 bn
7.66%
1 ene 1980 año
16.182 bn
+503.484 millones
3.21%
1 ene 1981 año
17.19 bn
+1.008 bn
6.23%
1 ene 1982 año
19.289 bn
+2.099 bn
12.21%
1 ene 1983 año
20.306 bn
+1.017 bn
5.27%
1 ene 1984 año
21.711 bn
+1.405 bn
6.92%
1 ene 1985 año
23.634 bn
+1.923 bn
8.86%
1 ene 1986 año
25.282 bn
+1.648 bn
6.97%
1 ene 1987 año
26.224 bn
+941.694 millones
3.72%
1 ene 1988 año
29.023 bn
+2.8 bn
10.68%
1 ene 1989 año
32.519 bn
+3.496 bn
12.04%
1 ene 1990 año
35.69 bn
+3.171 bn
9.75%
1 ene 1991 año
38.551 bn
+2.861 bn
8.02%
1 ene 1992 año
41.261 bn
+2.71 bn
7.03%
1 ene 1993 año
44.091 bn
+2.83 bn
6.86%
1 ene 1994 año
48.662 bn
+4.571 bn
10.37%
1 ene 1995 año
54.284 bn
+5.623 bn
11.55%
1 ene 1996 año
54.517 bn
+232.343 millones
0.43%
1 ene 1997 año
58.64 bn
+4.124 bn
7.56%
1 ene 1998 año
60.898 bn
+2.258 bn
3.85%
1 ene 1999 año
61.826 bn
+928.053 millones
1.52%
1 ene 2000 año
65.418 bn
+3.592 bn
5.81%
1 ene 2001 año
73.534 bn
+8.115 bn
12.41%
1 ene 2002 año
76.557 bn
+3.024 bn
4.11%
1 ene 2003 año
79.186 bn
+2.628 bn
3.43%
1 ene 2004 año
83.365 bn
+4.179 bn
5.28%
1 ene 2005 año
85.268 bn
+1.904 bn
2.28%
1 ene 2006 año
89.994 bn
+4.726 bn
5.54%
1 ene 2007 año
94.787 bn
+4.793 bn
5.33%
1 ene 2008 año
98.643 bn
+3.856 bn
4.07%
1 ene 2009 año
105.359 bn
+6.716 bn
6.81%
1 ene 2010 año
102.597 bn
-2.762 bn
-2.62%
1 ene 2011 año
108.072 bn
+5.475 bn
5.34%
1 ene 2012 año
110.145 bn
+2.073 bn
1.92%
1 ene 2013 año
113.619 bn
+3.474 bn
3.15%
1 ene 2014 año
117.941 bn
+4.322 bn
3.8%
1 ene 2015 año
123.683 bn
+5.742 bn
4.87%
1 ene 2016 año
130.682 bn
+6.998 bn
5.66%
Ranking de los países por los datos estadísticos actuales


Comentarios: