29
/es/
es
AIzaSyAYiBZKx7MnpbEhh9jyipgxe19OcubqV5w
April 1, 2024
30647
Europe & Central Asia
ECS
false
2
1
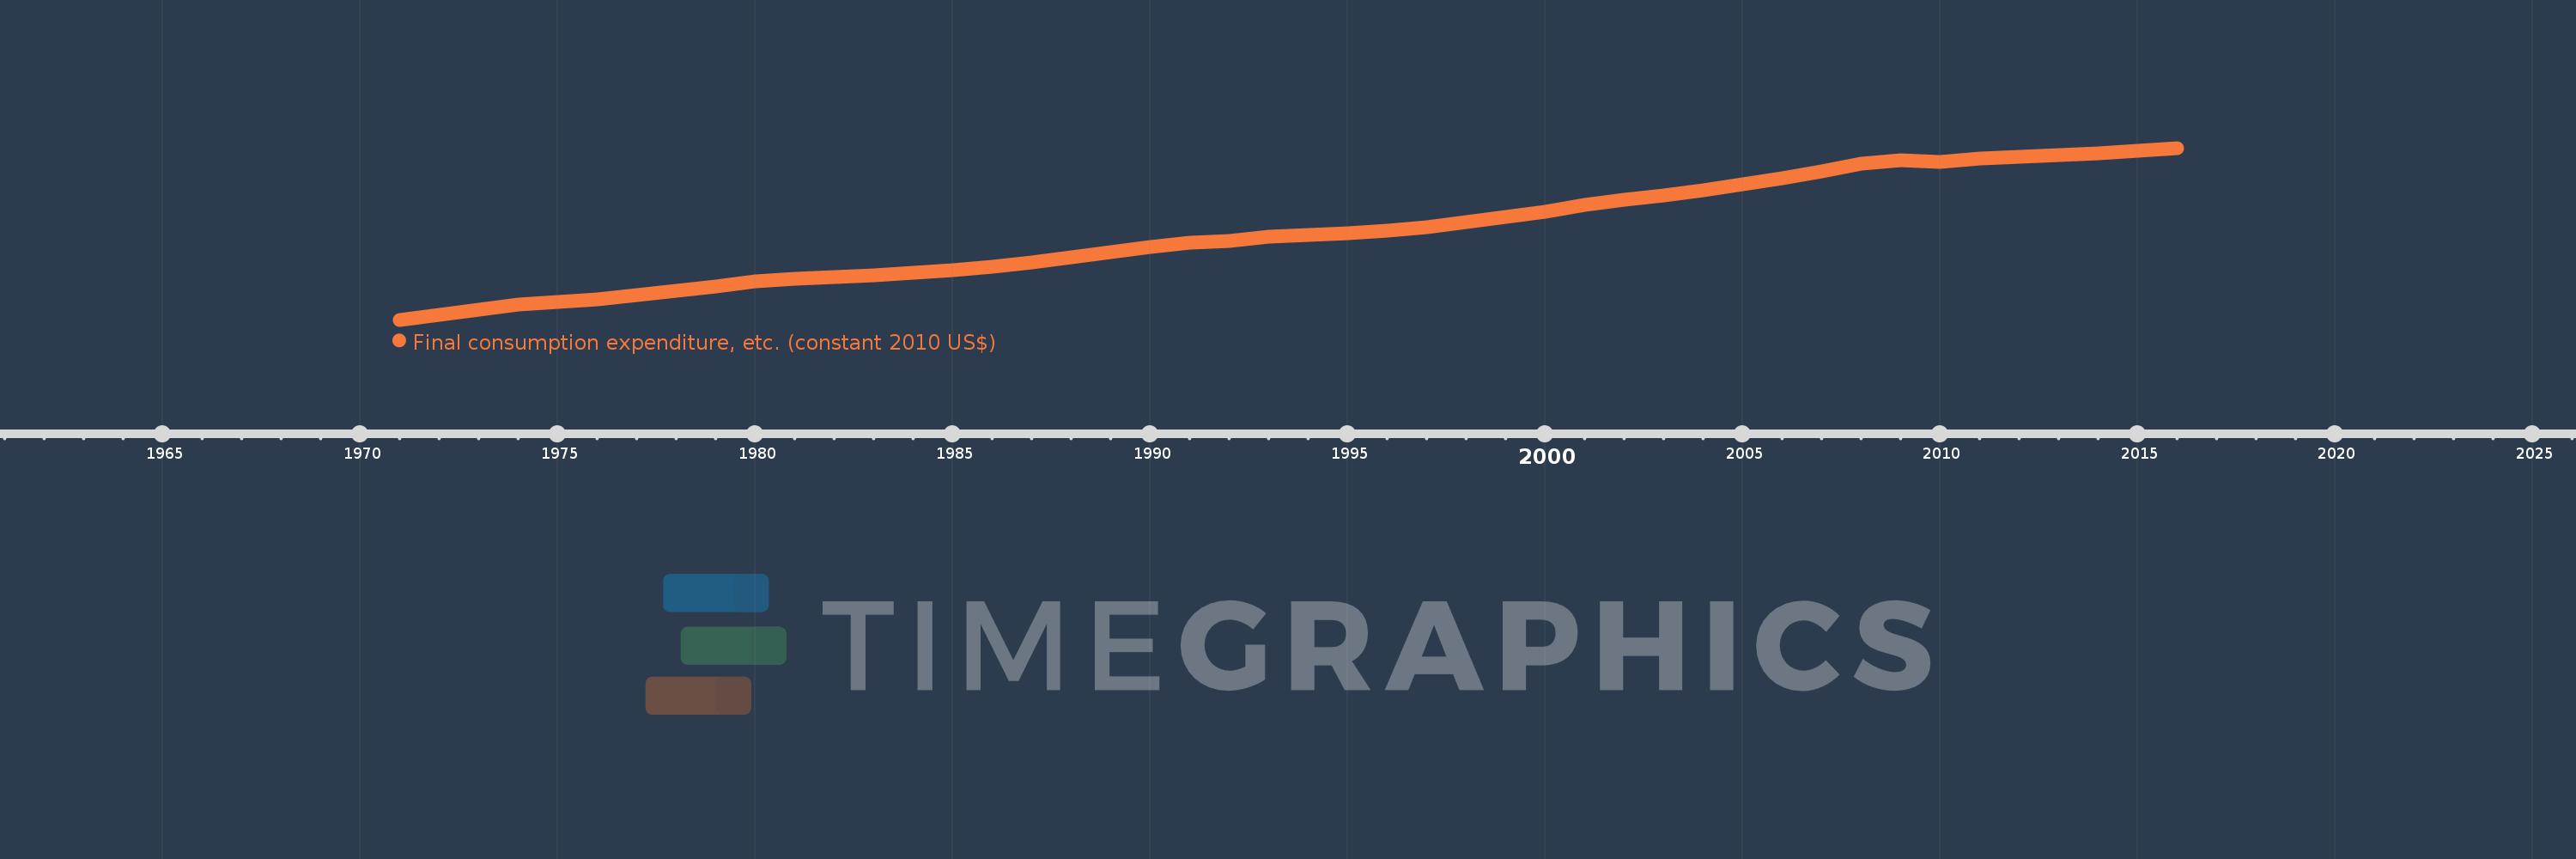
Final consumption expenditure, etc. (constant 2010 US$)
2016,2015,2014,2013,2012,2011,2010,2009,2008,2007,2006,2005,2004,2003,2002,2001,2000,1999,1998,1997,1996,1995,1994,1993,1992,1991,1990,1989,1988,1987,1986,1985,1984,1983,1982,1981,1980,1979,1978,1977,1976,1975,1974,1973,1972,1971
Estas estadísticas en otros países:
AfghanistanAlbaniaAlgeriaAngolaAntigua and BarbudaArab WorldArgentinaArmeniaArubaAustraliaAustriaAzerbaijanBahamas, TheBahrainBangladeshBarbadosBelarusBelgiumBelizeBeninBermudaBhutanBoliviaBosnia and HerzegovinaBotswanaBrazilBrunei DarussalamBulgariaBurkina FasoBurundiCabo VerdeCambodiaCameroonCanadaCaribbean small statesCentral African RepublicCentral Europe and the BalticsChadChileChinaColombiaComorosCongo, Dem. Rep.Congo, Rep.Cote d'IvoireCroatiaCubaCyprusCzech RepublicDenmarkDominicaDominican RepublicEarly-demographic dividendEast Asia & PacificEast Asia & Pacific (excluding high income)East Asia & Pacific (IDA & IBRD countries)EcuadorEgypt, Arab Rep.El SalvadorEquatorial GuineaEritreaEstoniaEuro areaEurope & Central AsiaEurope & Central Asia (excluding high income)Europe & Central Asia (IDA & IBRD countries)European UnionFaroe IslandsFinlandFragile and conflict affected situationsFranceGabonGambia, TheGeorgiaGermanyGhanaGreeceGrenadaGuatemalaGuineaGuinea-BissauGuyanaHaitiHeavily indebted poor countries (HIPC)High incomeHondurasHong Kong SAR, ChinaHungaryIBRD onlyIcelandIDA & IBRD totalIDA blendIDA onlyIDA totalIndiaIndonesiaIran, Islamic Rep.IraqIrelandIsraelItalyJamaicaJapanJordanKazakhstanKenyaKorea, Rep.KosovoKuwaitKyrgyz RepublicLao PDRLate-demographic dividendLatin America & Caribbean Latin America & Caribbean (excluding high income)Latin America & the Caribbean (IDA & IBRD countries)LatviaLeast developed countries: UN classificationLebanonLiberiaLithuaniaLow & middle incomeLow incomeLower middle incomeLuxembourgMacao SAR, ChinaMacedonia, FYRMadagascarMalawiMalaysiaMaliMaltaMauritaniaMauritiusMexicoMiddle East & North AfricaMiddle East & North Africa (excluding high income)Middle East & North Africa (IDA & IBRD countries)Middle incomeMoldovaMongoliaMontenegroMoroccoMozambiqueNamibiaNepalNetherlandsNew ZealandNicaraguaNigerNigeriaNorth AmericaNorwayOECD membersOmanOther small statesPakistanPanamaParaguayPeruPhilippinesPolandPortugalPost-demographic dividendPre-demographic dividendPuerto RicoQatarRomaniaRussian FederationRwandaSaudi ArabiaSenegalSerbiaSeychellesSierra LeoneSingaporeSlovak RepublicSloveniaSmall statesSouth AfricaSouth AsiaSouth Asia (IDA & IBRD)South SudanSpainSri LankaSt. Kitts and NevisSt. LuciaSt. Vincent and the GrenadinesSub-Saharan Africa Sub-Saharan Africa (excluding high income)Sub-Saharan Africa (IDA & IBRD countries)SudanSurinameSwazilandSwedenSwitzerlandTajikistanTanzaniaThailandTimor-LesteTogoTongaTrinidad and TobagoTunisiaTurkeyTurkmenistanUgandaUkraineUnited Arab EmiratesUnited KingdomUnited StatesUpper middle incomeUruguayUzbekistanVanuatuVenezuela, RBVietnamWest Bank and GazaWorldYemen, Rep.ZambiaZimbabwe línea de tiempo (timeline):
En esta escala de tiempo se presenta un gráfico de 1971 y 2016 de Europe & Central Asia. Los datos de 1970 están ausentes. El número de observaciones reales por fecha: 46.
Fuente (nombre):
Indicadores del desarrollo mundial
Fuente (organización):
World Bank national accounts data, and OECD National Accounts data files.
Categorías:
Economy & Growth
Se ha actualizado:
23 abr 2017 año
Los indicadores de los cambios de valor en los últimos años
En promedio:
11.516 billones
Mínimo:
6.012 billones
1 ene 1971 año
Máximo:
16.846 billones
1 ene 2016 año
A la fecha de observación
Valor
Cambio absoluto
El cambio con respecto al valor anterior
1 ene 1971 año
6.012 billones
+6.012 billones
0.0%
1 ene 1972 año
6.303 billones
+291.279 bn
4.84%
1 ene 1973 año
6.641 billones
+337.476 bn
5.35%
1 ene 1974 año
6.973 billones
+332.165 bn
5.0%
1 ene 1975 año
7.14 billones
+167.177 bn
2.4%
1 ene 1976 año
7.307 billones
+166.874 bn
2.34%
1 ene 1977 año
7.585 billones
+278.112 bn
3.81%
1 ene 1978 año
7.825 billones
+240.181 bn
3.17%
1 ene 1979 año
8.122 billones
+296.814 bn
3.79%
1 ene 1980 año
8.417 billones
+294.974 bn
3.63%
1 ene 1981 año
8.577 billones
+160.133 bn
1.9%
1 ene 1982 año
8.719 billones
+141.384 bn
1.65%
1 ene 1983 año
8.822 billones
+103.2 bn
1.18%
1 ene 1984 año
8.979 billones
+156.807 bn
1.78%
1 ene 1985 año
9.134 billones
+155.324 bn
1.73%
1 ene 1986 año
9.37 billones
+235.874 bn
2.58%
1 ene 1987 año
9.639 billones
+269.385 bn
2.88%
1 ene 1988 año
9.953 billones
+313.615 bn
3.25%
1 ene 1989 año
10.286 billones
+332.875 bn
3.34%
1 ene 1990 año
10.573 billones
+287.845 bn
2.8%
1 ene 1991 año
10.874 billones
+300.54 bn
2.84%
1 ene 1992 año
11.0 billones
+125.918 bn
1.16%
1 ene 1993 año
11.267 billones
+267.043 bn
2.43%
1 ene 1994 año
11.355 billones
+88.385 bn
0.78%
1 ene 1995 año
11.46 billones
+104.456 bn
0.92%
1 ene 1996 año
11.613 billones
+153.378 bn
1.34%
1 ene 1997 año
11.862 billones
+248.319 bn
2.14%
1 ene 1998 año
12.146 billones
+284.381 bn
2.4%
1 ene 1999 año
12.485 billones
+339.208 bn
2.79%
1 ene 2000 año
12.842 billones
+356.819 bn
2.86%
1 ene 2001 año
13.262 billones
+420.493 bn
3.27%
1 ene 2002 año
13.553 billones
+290.482 bn
2.19%
1 ene 2003 año
13.849 billones
+296.464 bn
2.19%
1 ene 2004 año
14.157 billones
+307.593 bn
2.22%
1 ene 2005 año
14.552 billones
+395.384 bn
2.79%
1 ene 2006 año
14.959 billones
+406.469 bn
2.79%
1 ene 2007 año
15.391 billones
+432.384 bn
2.89%
1 ene 2008 año
15.842 billones
+451.231 bn
2.93%
1 ene 2009 año
16.079 billones
+236.318 bn
1.49%
1 ene 2010 año
15.953 billones
-125.51 bn
-0.78%
1 ene 2011 año
16.158 billones
+205.156 bn
1.29%
1 ene 2012 año
16.301 billones
+142.731 bn
0.88%
1 ene 2013 año
16.373 billones
+72.084 bn
0.44%
1 ene 2014 año
16.49 billones
+116.498 bn
0.71%
1 ene 2015 año
16.669 billones
+179.284 bn
1.09%
1 ene 2016 año
16.846 billones
+177.034 bn
1.06%
Ranking de los países por los datos estadísticos actuales


Comentarios: