29
/es/
es
AIzaSyAYiBZKx7MnpbEhh9jyipgxe19OcubqV5w
April 1, 2024
37317
IDA & IBRD total
IBT
false
2
1
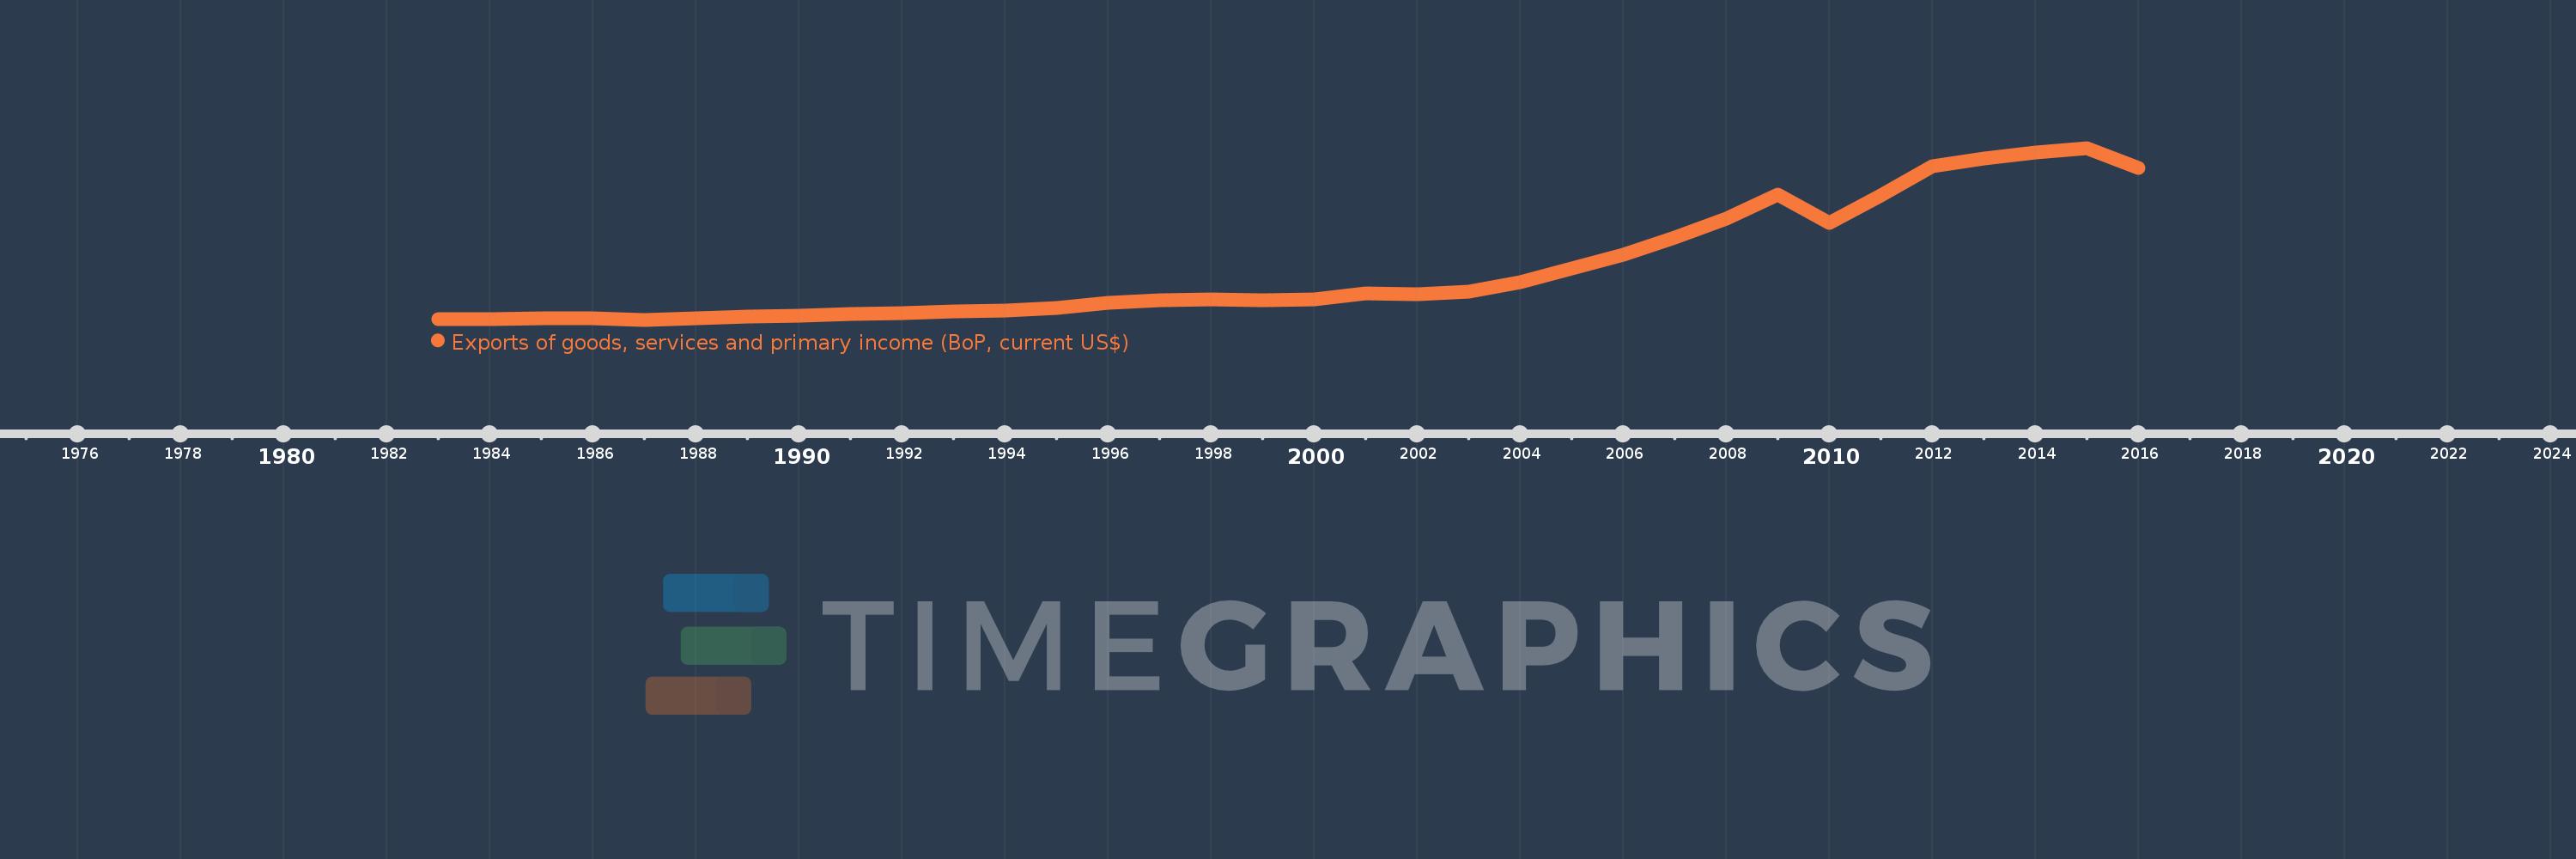
Exports of goods, services and primary income (BoP, current US$)
2016,2015,2014,2013,2012,2011,2010,2009,2008,2007,2006,2005,2004,2003,2002,2001,2000,1999,1998,1997,1996,1995,1994,1993,1992,1991,1990,1989,1988,1987,1986,1985,1984,1983
Estas estadísticas en otros países:
AfghanistanAlbaniaAlgeriaAngolaAntigua and BarbudaArab WorldArgentinaArmeniaArubaAustraliaAustriaAzerbaijanBahamas, TheBahrainBangladeshBarbadosBelarusBelgiumBelizeBeninBermudaBhutanBoliviaBosnia and HerzegovinaBotswanaBrazilBrunei DarussalamBulgariaBurkina FasoBurundiCabo VerdeCambodiaCameroonCanadaCaribbean small statesCentral African RepublicCentral Europe and the BalticsChadChileChinaColombiaComorosCongo, Dem. Rep.Congo, Rep.Costa RicaCote d'IvoireCroatiaCuracaoCyprusCzech RepublicDenmarkDjiboutiDominicaDominican RepublicEarly-demographic dividendEast Asia & PacificEast Asia & Pacific (excluding high income)East Asia & Pacific (IDA & IBRD countries)EcuadorEgypt, Arab Rep.El SalvadorEquatorial GuineaEritreaEstoniaEthiopiaEuro areaEurope & Central AsiaEurope & Central Asia (excluding high income)Europe & Central Asia (IDA & IBRD countries)European UnionFaroe IslandsFijiFinlandFragile and conflict affected situationsFranceFrench PolynesiaGabonGambia, TheGeorgiaGermanyGhanaGreeceGrenadaGuatemalaGuineaGuinea-BissauGuyanaHaitiHeavily indebted poor countries (HIPC)High incomeHondurasHong Kong SAR, ChinaHungaryIBRD onlyIcelandIDA & IBRD totalIDA blendIDA onlyIDA totalIndiaIndonesiaIran, Islamic Rep.IraqIrelandIsraelItalyJamaicaJapanJordanKazakhstanKenyaKiribatiKorea, Rep.KosovoKuwaitKyrgyz RepublicLao PDRLate-demographic dividendLatin America & Caribbean Latin America & Caribbean (excluding high income)Latin America & the Caribbean (IDA & IBRD countries)LatviaLeast developed countries: UN classificationLebanonLesothoLiberiaLibyaLithuaniaLow & middle incomeLow incomeLower middle incomeLuxembourgMacao SAR, ChinaMacedonia, FYRMadagascarMalawiMalaysiaMaldivesMaliMaltaMarshall IslandsMauritaniaMauritiusMexicoMicronesia, Fed. Sts.Middle East & North Africa (excluding high income)Middle East & North Africa (IDA & IBRD countries)Middle incomeMoldovaMongoliaMontenegroMoroccoMozambiqueMyanmarNamibiaNepalNetherlandsNew CaledoniaNicaraguaNigerNigeriaNorth AmericaNorwayOECD membersOmanPacific island small statesPakistanPalauPanamaPapua New GuineaParaguayPeruPhilippinesPolandPortugalPost-demographic dividendPre-demographic dividendQatarRomaniaRussian FederationRwandaSamoaSao Tome and PrincipeSaudi ArabiaSenegalSerbiaSeychellesSierra LeoneSingaporeSint Maarten (Dutch part)Slovak RepublicSloveniaSolomon IslandsSouth AfricaSouth AsiaSouth Asia (IDA & IBRD)South SudanSpainSri LankaSt. Kitts and NevisSt. LuciaSt. Vincent and the GrenadinesSub-Saharan Africa Sub-Saharan Africa (excluding high income)Sub-Saharan Africa (IDA & IBRD countries)SudanSurinameSwazilandSwedenSwitzerlandSyrian Arab RepublicTajikistanTanzaniaThailandTimor-LesteTogoTongaTrinidad and TobagoTunisiaTurkeyTuvaluUgandaUkraineUnited KingdomUnited StatesUpper middle incomeUruguayVanuatuVenezuela, RBVietnamWest Bank and GazaWorldYemen, Rep.ZambiaZimbabwe línea de tiempo (timeline):
En esta escala de tiempo se presenta un gráfico de 1983 y 2016 de IDA & IBRD total. Los datos de 1982 están ausentes. El número de observaciones reales por fecha: 34.
Fuente (nombre):
Indicadores del desarrollo mundial
Fuente (organización):
International Monetary Fund, Balance of Payments Statistics Yearbook and data files.
Categorías:
Economy & Growth, External Debt, Trade
Se ha actualizado:
23 abr 2017 año
Los indicadores de los cambios de valor en los últimos años
En promedio:
2.749 billones
Mínimo:
413.143 bn
1 ene 1987 año
Máximo:
8.355 billones
1 ene 2015 año
A la fecha de observación
Valor
Cambio absoluto
El cambio con respecto al valor anterior
1 ene 1983 año
460.385 bn
+460.385 bn
0.0%
1 ene 1984 año
453.563 bn
-6.822 bn
-1.48%
1 ene 1985 año
479.976 bn
+26.413 bn
5.82%
1 ene 1986 año
463.261 bn
-16.715 bn
-3.48%
1 ene 1987 año
413.143 bn
-50.117 bn
-10.82%
1 ene 1988 año
487.425 bn
+74.281 bn
17.98%
1 ene 1989 año
542.415 bn
+54.99 bn
11.28%
1 ene 1990 año
596.525 bn
+54.111 bn
9.98%
1 ene 1991 año
689.716 bn
+93.191 bn
15.62%
1 ene 1992 año
711.515 bn
+21.798 bn
3.16%
1 ene 1993 año
781.614 bn
+70.1 bn
9.85%
1 ene 1994 año
831.255 bn
+49.64 bn
6.35%
1 ene 1995 año
973.328 bn
+142.073 bn
17.09%
1 ene 1996 año
1.178 billones
+204.199 bn
20.98%
1 ene 1997 año
1.306 billones
+128.094 bn
10.88%
1 ene 1998 año
1.335 billones
+29.314 bn
2.25%
1 ene 1999 año
1.31 billones
-25.304 bn
-1.9%
1 ene 2000 año
1.344 billones
+34.021 bn
2.6%
1 ene 2001 año
1.626 billones
+282.409 bn
21.02%
1 ene 2002 año
1.605 billones
-20.95 bn
-1.29%
1 ene 2003 año
1.702 billones
+97.044 bn
6.05%
1 ene 2004 año
2.162 billones
+460.313 bn
27.04%
1 ene 2005 año
2.764 billones
+601.518 bn
27.82%
1 ene 2006 año
3.422 billones
+658.476 bn
23.82%
1 ene 2007 año
4.194 billones
+771.479 bn
22.54%
1 ene 2008 año
5.1 billones
+906.402 bn
21.61%
1 ene 2009 año
6.197 billones
+1.097 billones
21.51%
1 ene 2010 año
4.904 billones
-1.294 billones
-20.87%
1 ene 2011 año
6.143 billones
+1.239 billones
25.27%
1 ene 2012 año
7.511 billones
+1.368 billones
22.26%
1 ene 2013 año
7.854 billones
+342.881 bn
4.57%
1 ene 2014 año
8.131 billones
+277.492 bn
3.53%
1 ene 2015 año
8.355 billones
+223.47 bn
2.75%
1 ene 2016 año
7.434 billones
-920.889 bn
-11.02%
Ranking de los países por los datos estadísticos actuales


Comentarios: