29
/es/
es
AIzaSyAYiBZKx7MnpbEhh9jyipgxe19OcubqV5w
April 1, 2024
212890
Nigeria
NGA
true
2
1
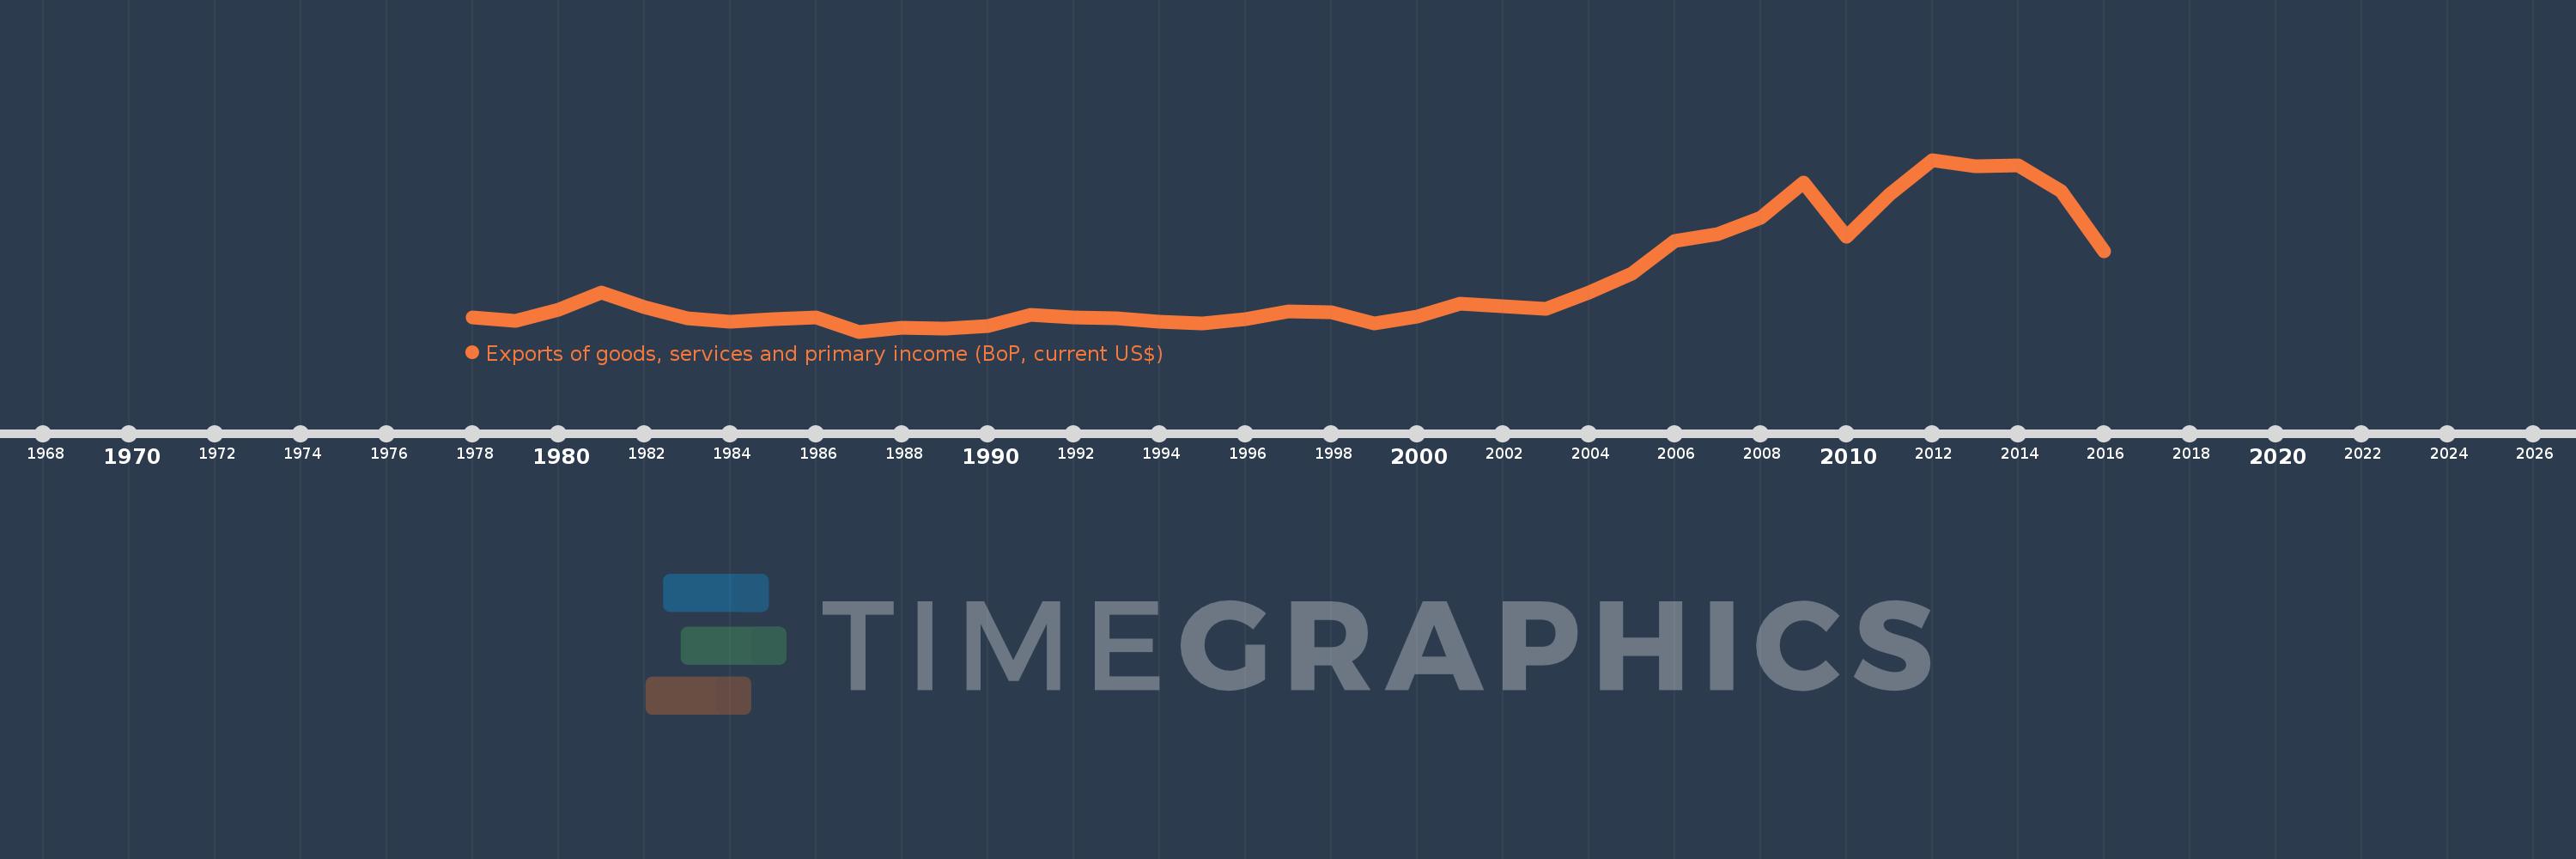
Exports of goods, services and primary income (BoP, current US$)
2016,2015,2014,2013,2012,2011,2010,2009,2008,2007,2006,2005,2004,2003,2002,2001,2000,1999,1998,1997,1996,1995,1994,1993,1992,1991,1990,1989,1988,1987,1986,1985,1984,1983,1982,1981,1980,1979,1978
Estas estadísticas en otros países:
AfghanistanAlbaniaAlgeriaAngolaAntigua and BarbudaArab WorldArgentinaArmeniaArubaAustraliaAustriaAzerbaijanBahamas, TheBahrainBangladeshBarbadosBelarusBelgiumBelizeBeninBermudaBhutanBoliviaBosnia and HerzegovinaBotswanaBrazilBrunei DarussalamBulgariaBurkina FasoBurundiCabo VerdeCambodiaCameroonCanadaCaribbean small statesCentral African RepublicCentral Europe and the BalticsChadChileChinaColombiaComorosCongo, Dem. Rep.Congo, Rep.Costa RicaCote d'IvoireCroatiaCuracaoCyprusCzech RepublicDenmarkDjiboutiDominicaDominican RepublicEarly-demographic dividendEast Asia & PacificEast Asia & Pacific (excluding high income)East Asia & Pacific (IDA & IBRD countries)EcuadorEgypt, Arab Rep.El SalvadorEquatorial GuineaEritreaEstoniaEthiopiaEuro areaEurope & Central AsiaEurope & Central Asia (excluding high income)Europe & Central Asia (IDA & IBRD countries)European UnionFaroe IslandsFijiFinlandFragile and conflict affected situationsFranceFrench PolynesiaGabonGambia, TheGeorgiaGermanyGhanaGreeceGrenadaGuatemalaGuineaGuinea-BissauGuyanaHaitiHeavily indebted poor countries (HIPC)High incomeHondurasHong Kong SAR, ChinaHungaryIBRD onlyIcelandIDA & IBRD totalIDA blendIDA onlyIDA totalIndiaIndonesiaIran, Islamic Rep.IraqIrelandIsraelItalyJamaicaJapanJordanKazakhstanKenyaKiribatiKorea, Rep.KosovoKuwaitKyrgyz RepublicLao PDRLate-demographic dividendLatin America & Caribbean Latin America & Caribbean (excluding high income)Latin America & the Caribbean (IDA & IBRD countries)LatviaLeast developed countries: UN classificationLebanonLesothoLiberiaLibyaLithuaniaLow & middle incomeLow incomeLower middle incomeLuxembourgMacao SAR, ChinaMacedonia, FYRMadagascarMalawiMalaysiaMaldivesMaliMaltaMarshall IslandsMauritaniaMauritiusMexicoMicronesia, Fed. Sts.Middle East & North Africa (excluding high income)Middle East & North Africa (IDA & IBRD countries)Middle incomeMoldovaMongoliaMontenegroMoroccoMozambiqueMyanmarNamibiaNepalNetherlandsNew CaledoniaNicaraguaNigerNigeriaNorth AmericaNorwayOECD membersOmanPacific island small statesPakistanPalauPanamaPapua New GuineaParaguayPeruPhilippinesPolandPortugalPost-demographic dividendPre-demographic dividendQatarRomaniaRussian FederationRwandaSamoaSao Tome and PrincipeSaudi ArabiaSenegalSerbiaSeychellesSierra LeoneSingaporeSint Maarten (Dutch part)Slovak RepublicSloveniaSolomon IslandsSouth AfricaSouth AsiaSouth Asia (IDA & IBRD)South SudanSpainSri LankaSt. Kitts and NevisSt. LuciaSt. Vincent and the GrenadinesSub-Saharan Africa Sub-Saharan Africa (excluding high income)Sub-Saharan Africa (IDA & IBRD countries)SudanSurinameSwazilandSwedenSwitzerlandSyrian Arab RepublicTajikistanTanzaniaThailandTimor-LesteTogoTongaTrinidad and TobagoTunisiaTurkeyTuvaluUgandaUkraineUnited KingdomUnited StatesUpper middle incomeUruguayVanuatuVenezuela, RBVietnamWest Bank and GazaWorldYemen, Rep.ZambiaZimbabwe línea de tiempo (timeline):
En esta escala de tiempo se presenta un gráfico de 1978 y 2016 de Nigeria. Los datos de 1977 están ausentes. El número de observaciones reales por fecha: 39.
Fuente (nombre):
Indicadores del desarrollo mundial
Fuente (organización):
International Monetary Fund, Balance of Payments Statistics Yearbook and data files.
Categorías:
Economy & Growth, External Debt, Trade
Se ha actualizado:
23 abr 2017 año
Los indicadores de los cambios de valor en los últimos años
Mínimo:
5.391 bn
1 ene 1987 año
Máximo:
103.336 bn
1 ene 2012 año
A la fecha de observación
Valor
Cambio absoluto
El cambio con respecto al valor anterior
1 ene 1978 año
13.287 bn
+13.287 bn
0.0%
1 ene 1979 año
11.608 bn
-1.679 bn
-12.64%
1 ene 1980 año
18.023 bn
+6.415 bn
55.27%
1 ene 1981 año
27.759 bn
+9.736 bn
54.02%
1 ene 1982 año
19.472 bn
-8.287 bn
-29.85%
1 ene 1983 año
12.883 bn
-6.589 bn
-33.84%
1 ene 1984 año
10.865 bn
-2.017 bn
-15.66%
1 ene 1985 año
12.347 bn
+1.481 bn
13.63%
1 ene 1986 año
13.51 bn
+1.164 bn
9.42%
1 ene 1987 año
5.391 bn
-8.119 bn
-60.1%
1 ene 1988 año
7.83 bn
+2.439 bn
45.23%
1 ene 1989 año
7.28 bn
-550.324 millones
-7.03%
1 ene 1990 año
8.575 bn
+1.296 bn
17.8%
1 ene 1991 año
14.761 bn
+6.186 bn
72.14%
1 ene 1992 año
13.351 bn
-1.41 bn
-9.55%
1 ene 1993 año
13.0 bn
-351.418 millones
-2.63%
1 ene 1994 año
11.13 bn
-1.869 bn
-14.38%
1 ene 1995 año
9.879 bn
-1.252 bn
-11.25%
1 ene 1996 año
12.443 bn
+2.564 bn
25.96%
1 ene 1997 año
16.965 bn
+4.522 bn
36.34%
1 ene 1998 año
16.252 bn
-712.381 millones
-4.2%
1 ene 1999 año
10.188 bn
-6.064 bn
-37.31%
1 ene 2000 año
14.096 bn
+3.908 bn
38.36%
1 ene 2001 año
21.183 bn
+7.087 bn
50.28%
1 ene 2002 año
19.844 bn
-1.338 bn
-6.32%
1 ene 2003 año
18.321 bn
-1.523 bn
-7.68%
1 ene 2004 año
27.531 bn
+9.21 bn
50.27%
1 ene 2005 año
38.26 bn
+10.729 bn
38.97%
1 ene 2006 año
57.149 bn
+18.89 bn
49.37%
1 ene 2007 año
61.109 bn
+3.96 bn
6.93%
1 ene 2008 año
70.046 bn
+8.937 bn
14.63%
1 ene 2009 año
90.388 bn
+20.341 bn
29.04%
1 ene 2010 año
59.321 bn
-31.067 bn
-34.37%
1 ene 2011 año
83.697 bn
+24.376 bn
41.09%
1 ene 2012 año
103.336 bn
+19.639 bn
23.46%
1 ene 2013 año
99.481 bn
-3.855 bn
-3.73%
1 ene 2014 año
100.3 bn
+819.432 millones
0.82%
1 ene 2015 año
85.523 bn
-14.778 bn
-14.73%
1 ene 2016 año
51.029 bn
-34.493 bn
-40.33%
Ranking de los países por los datos estadísticos actuales


Comentarios: