29
/es/
es
AIzaSyAYiBZKx7MnpbEhh9jyipgxe19OcubqV5w
April 1, 2024
245519
South Africa
ZAF
true
2
1
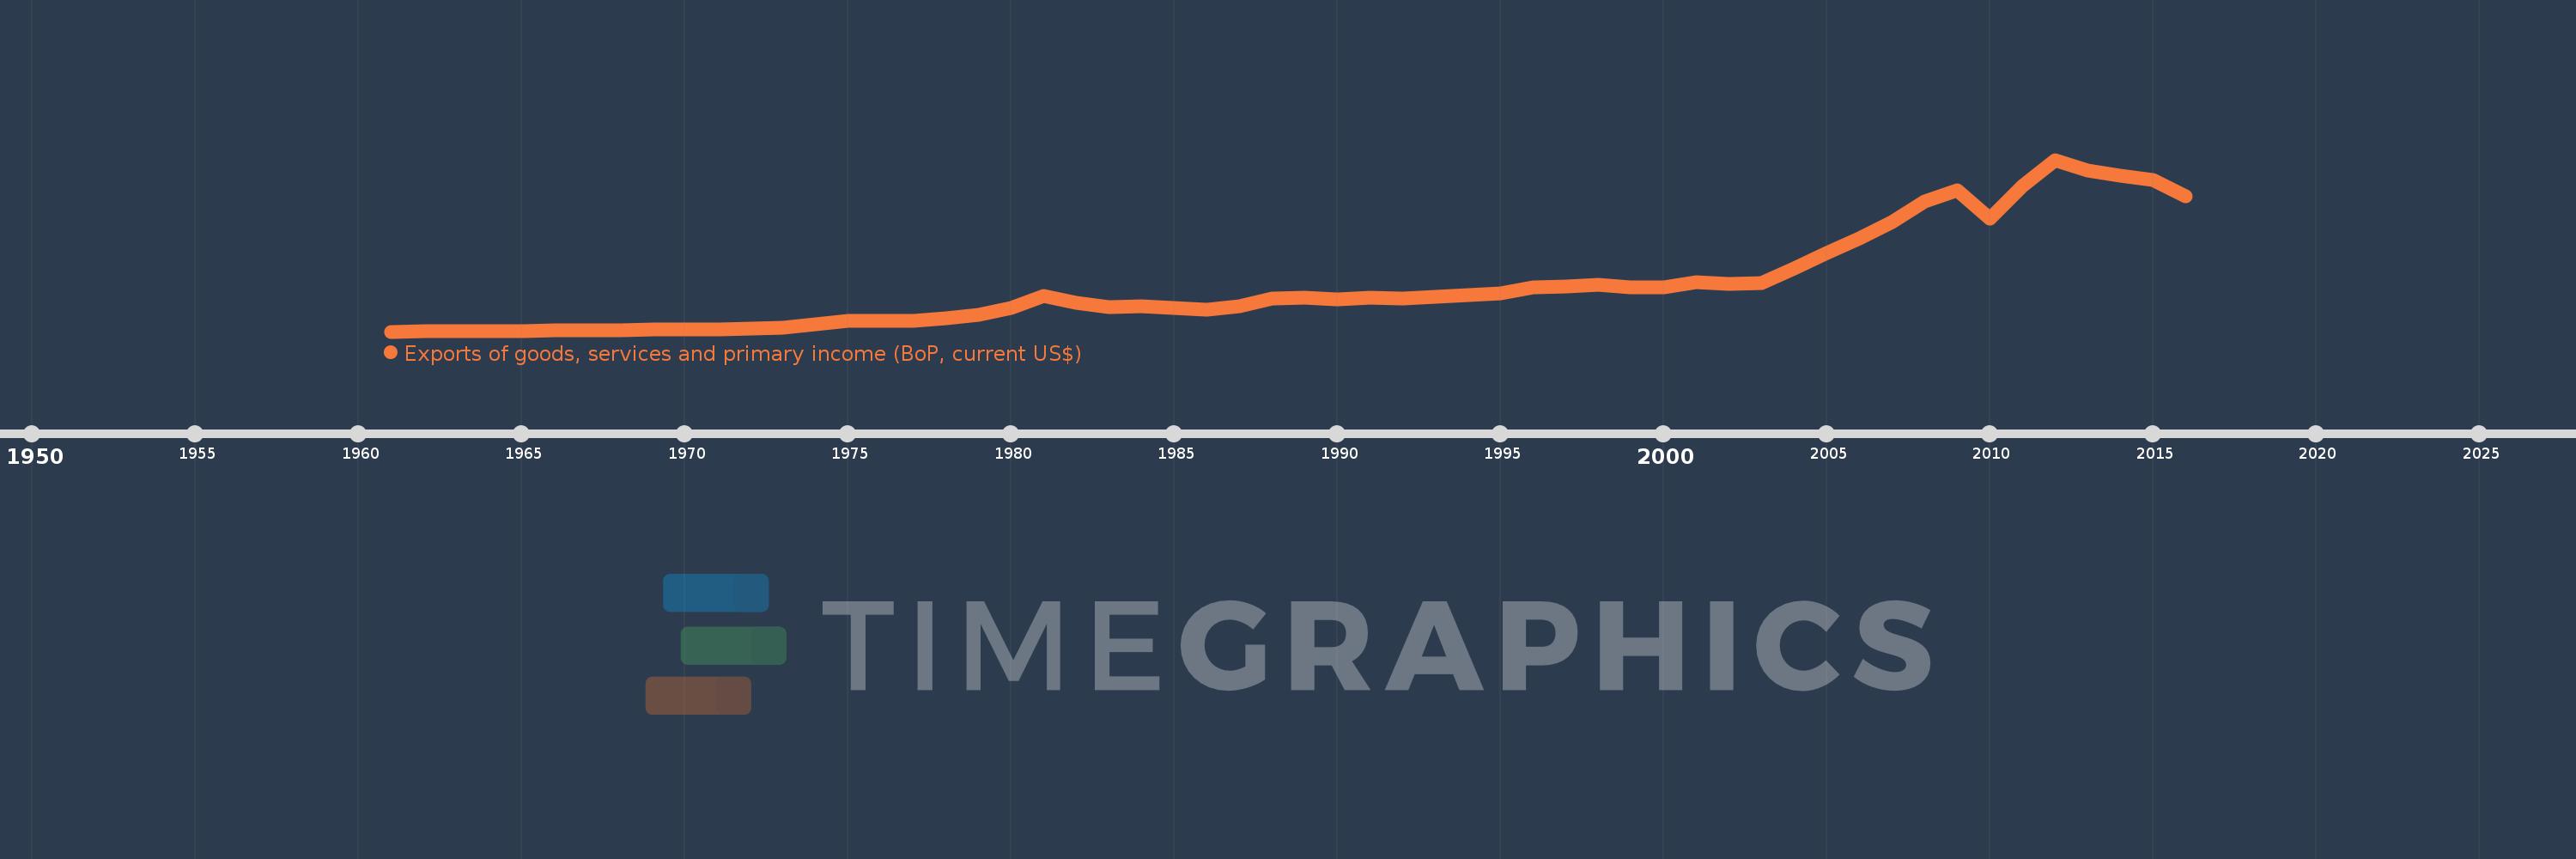
Exports of goods, services and primary income (BoP, current US$)
2016,2015,2014,2013,2012,2011,2010,2009,2008,2007,2006,2005,2004,2003,2002,2001,2000,1999,1998,1997,1996,1995,1994,1993,1992,1991,1990,1989,1988,1987,1986,1985,1984,1983,1982,1981,1980,1979,1978,1977,1976,1975,1974,1973,1972,1971,1970,1969,1968,1967,1966,1965,1964,1963,1962,1961
Estas estadísticas en otros países:
AfghanistanAlbaniaAlgeriaAngolaAntigua and BarbudaArab WorldArgentinaArmeniaArubaAustraliaAustriaAzerbaijanBahamas, TheBahrainBangladeshBarbadosBelarusBelgiumBelizeBeninBermudaBhutanBoliviaBosnia and HerzegovinaBotswanaBrazilBrunei DarussalamBulgariaBurkina FasoBurundiCabo VerdeCambodiaCameroonCanadaCaribbean small statesCentral African RepublicCentral Europe and the BalticsChadChileChinaColombiaComorosCongo, Dem. Rep.Congo, Rep.Costa RicaCote d'IvoireCroatiaCuracaoCyprusCzech RepublicDenmarkDjiboutiDominicaDominican RepublicEarly-demographic dividendEast Asia & PacificEast Asia & Pacific (excluding high income)East Asia & Pacific (IDA & IBRD countries)EcuadorEgypt, Arab Rep.El SalvadorEquatorial GuineaEritreaEstoniaEthiopiaEuro areaEurope & Central AsiaEurope & Central Asia (excluding high income)Europe & Central Asia (IDA & IBRD countries)European UnionFaroe IslandsFijiFinlandFragile and conflict affected situationsFranceFrench PolynesiaGabonGambia, TheGeorgiaGermanyGhanaGreeceGrenadaGuatemalaGuineaGuinea-BissauGuyanaHaitiHeavily indebted poor countries (HIPC)High incomeHondurasHong Kong SAR, ChinaHungaryIBRD onlyIcelandIDA & IBRD totalIDA blendIDA onlyIDA totalIndiaIndonesiaIran, Islamic Rep.IraqIrelandIsraelItalyJamaicaJapanJordanKazakhstanKenyaKiribatiKorea, Rep.KosovoKuwaitKyrgyz RepublicLao PDRLate-demographic dividendLatin America & Caribbean Latin America & Caribbean (excluding high income)Latin America & the Caribbean (IDA & IBRD countries)LatviaLeast developed countries: UN classificationLebanonLesothoLiberiaLibyaLithuaniaLow & middle incomeLow incomeLower middle incomeLuxembourgMacao SAR, ChinaMacedonia, FYRMadagascarMalawiMalaysiaMaldivesMaliMaltaMarshall IslandsMauritaniaMauritiusMexicoMicronesia, Fed. Sts.Middle East & North Africa (excluding high income)Middle East & North Africa (IDA & IBRD countries)Middle incomeMoldovaMongoliaMontenegroMoroccoMozambiqueMyanmarNamibiaNepalNetherlandsNew CaledoniaNicaraguaNigerNigeriaNorth AmericaNorwayOECD membersOmanPacific island small statesPakistanPalauPanamaPapua New GuineaParaguayPeruPhilippinesPolandPortugalPost-demographic dividendPre-demographic dividendQatarRomaniaRussian FederationRwandaSamoaSao Tome and PrincipeSaudi ArabiaSenegalSerbiaSeychellesSierra LeoneSingaporeSint Maarten (Dutch part)Slovak RepublicSloveniaSolomon IslandsSouth AfricaSouth AsiaSouth Asia (IDA & IBRD)South SudanSpainSri LankaSt. Kitts and NevisSt. LuciaSt. Vincent and the GrenadinesSub-Saharan Africa Sub-Saharan Africa (excluding high income)Sub-Saharan Africa (IDA & IBRD countries)SudanSurinameSwazilandSwedenSwitzerlandSyrian Arab RepublicTajikistanTanzaniaThailandTimor-LesteTogoTongaTrinidad and TobagoTunisiaTurkeyTuvaluUgandaUkraineUnited KingdomUnited StatesUpper middle incomeUruguayVanuatuVenezuela, RBVietnamWest Bank and GazaWorldYemen, Rep.ZambiaZimbabwe línea de tiempo (timeline):
En esta escala de tiempo se presenta un gráfico de 1961 y 2016 de South Africa. Los datos de 1960 están ausentes. El número de observaciones reales por fecha: 56.
Fuente (nombre):
Indicadores del desarrollo mundial
Fuente (organización):
International Monetary Fund, Balance of Payments Statistics Yearbook and data files.
Categorías:
Economy & Growth, External Debt, Trade
Se ha actualizado:
23 abr 2017 año
Los indicadores de los cambios de valor en los últimos años
Mínimo:
2.304 bn
1 ene 1961 año
Máximo:
132.17 bn
1 ene 2012 año
A la fecha de observación
Valor
Cambio absoluto
El cambio con respecto al valor anterior
1 ene 1961 año
2.304 bn
+2.304 bn
0.0%
1 ene 1962 año
2.402 bn
+98.0 millones
4.25%
1 ene 1963 año
2.573 bn
+170.8 millones
7.11%
1 ene 1964 año
2.759 bn
+186.2 millones
7.24%
1 ene 1965 año
2.93 bn
+170.8 millones
6.19%
1 ene 1966 año
3.002 bn
+71.4 millones
2.44%
1 ene 1967 año
3.234 bn
+232.4 millones
7.74%
1 ene 1968 año
3.528 bn
+294.0 millones
9.09%
1 ene 1969 año
3.91 bn
+382.2 millones
10.83%
1 ene 1970 año
4.035 bn
+124.6 millones
3.19%
1 ene 1971 año
4.081 bn
+46.2 millones
1.15%
1 ene 1972 año
4.528 bn
+447.101 millones
10.96%
1 ene 1973 año
5.469 bn
+940.59 millones
20.77%
1 ene 1974 año
7.612 bn
+2.143 bn
39.2%
1 ene 1975 año
10.3 bn
+2.688 bn
35.32%
1 ene 1976 año
10.631 bn
+330.296 millones
3.21%
1 ene 1977 año
10.206 bn
-424.497 millones
-3.99%
1 ene 1978 año
12.178 bn
+1.972 bn
19.32%
1 ene 1979 año
15.067 bn
+2.889 bn
23.72%
1 ene 1980 año
20.294 bn
+5.227 bn
34.69%
1 ene 1981 año
29.076 bn
+8.782 bn
43.27%
1 ene 1982 año
24.166 bn
-4.909 bn
-16.88%
1 ene 1983 año
20.549 bn
-3.618 bn
-14.97%
1 ene 1984 año
21.635 bn
+1.086 bn
5.29%
1 ene 1985 año
20.026 bn
-1.608 bn
-7.43%
1 ene 1986 año
19.003 bn
-1.024 bn
-5.11%
1 ene 1987 año
21.145 bn
+2.142 bn
11.27%
1 ene 1988 año
27.337 bn
+6.192 bn
29.29%
1 ene 1989 año
28.015 bn
+677.768 millones
2.48%
1 ene 1990 año
26.788 bn
-1.228 bn
-4.38%
1 ene 1991 año
27.818 bn
+1.03 bn
3.85%
1 ene 1992 año
27.0 bn
-817.44 millones
-2.94%
1 ene 1993 año
28.823 bn
+1.823 bn
6.75%
1 ene 1994 año
29.991 bn
+1.167 bn
4.05%
1 ene 1995 año
30.974 bn
+982.907 millones
3.28%
1 ene 1996 año
35.538 bn
+4.564 bn
14.74%
1 ene 1997 año
36.572 bn
+1.034 bn
2.91%
1 ene 1998 año
37.96 bn
+1.388 bn
3.79%
1 ene 1999 año
36.069 bn
-1.891 bn
-4.98%
1 ene 2000 año
35.535 bn
-534.013 millones
-1.48%
1 ene 2001 año
39.507 bn
+3.972 bn
11.18%
1 ene 2002 año
38.389 bn
-1.118 bn
-2.83%
1 ene 2003 año
39.061 bn
+672.164 millones
1.75%
1 ene 2004 año
50.215 bn
+11.154 bn
28.56%
1 ene 2005 año
61.695 bn
+11.48 bn
22.86%
1 ene 2006 año
72.73 bn
+11.035 bn
17.89%
1 ene 2007 año
85.295 bn
+12.565 bn
17.28%
1 ene 2008 año
100.413 bn
+15.118 bn
17.72%
1 ene 2009 año
108.974 bn
+8.561 bn
8.53%
1 ene 2010 año
87.745 bn
-21.229 bn
-19.48%
1 ene 2011 año
112.387 bn
+24.642 bn
28.08%
1 ene 2012 año
132.17 bn
+19.783 bn
17.6%
1 ene 2013 año
123.784 bn
-8.386 bn
-6.34%
1 ene 2014 año
119.856 bn
-3.928 bn
-3.17%
1 ene 2015 año
117.102 bn
-2.753 bn
-2.3%
1 ene 2016 año
104.802 bn
-12.3 bn
-10.5%
Ranking de los países por los datos estadísticos actuales


Comentarios: