29
/es/
es
AIzaSyAYiBZKx7MnpbEhh9jyipgxe19OcubqV5w
April 1, 2024
240406
Singapore
SGP
true
2
1
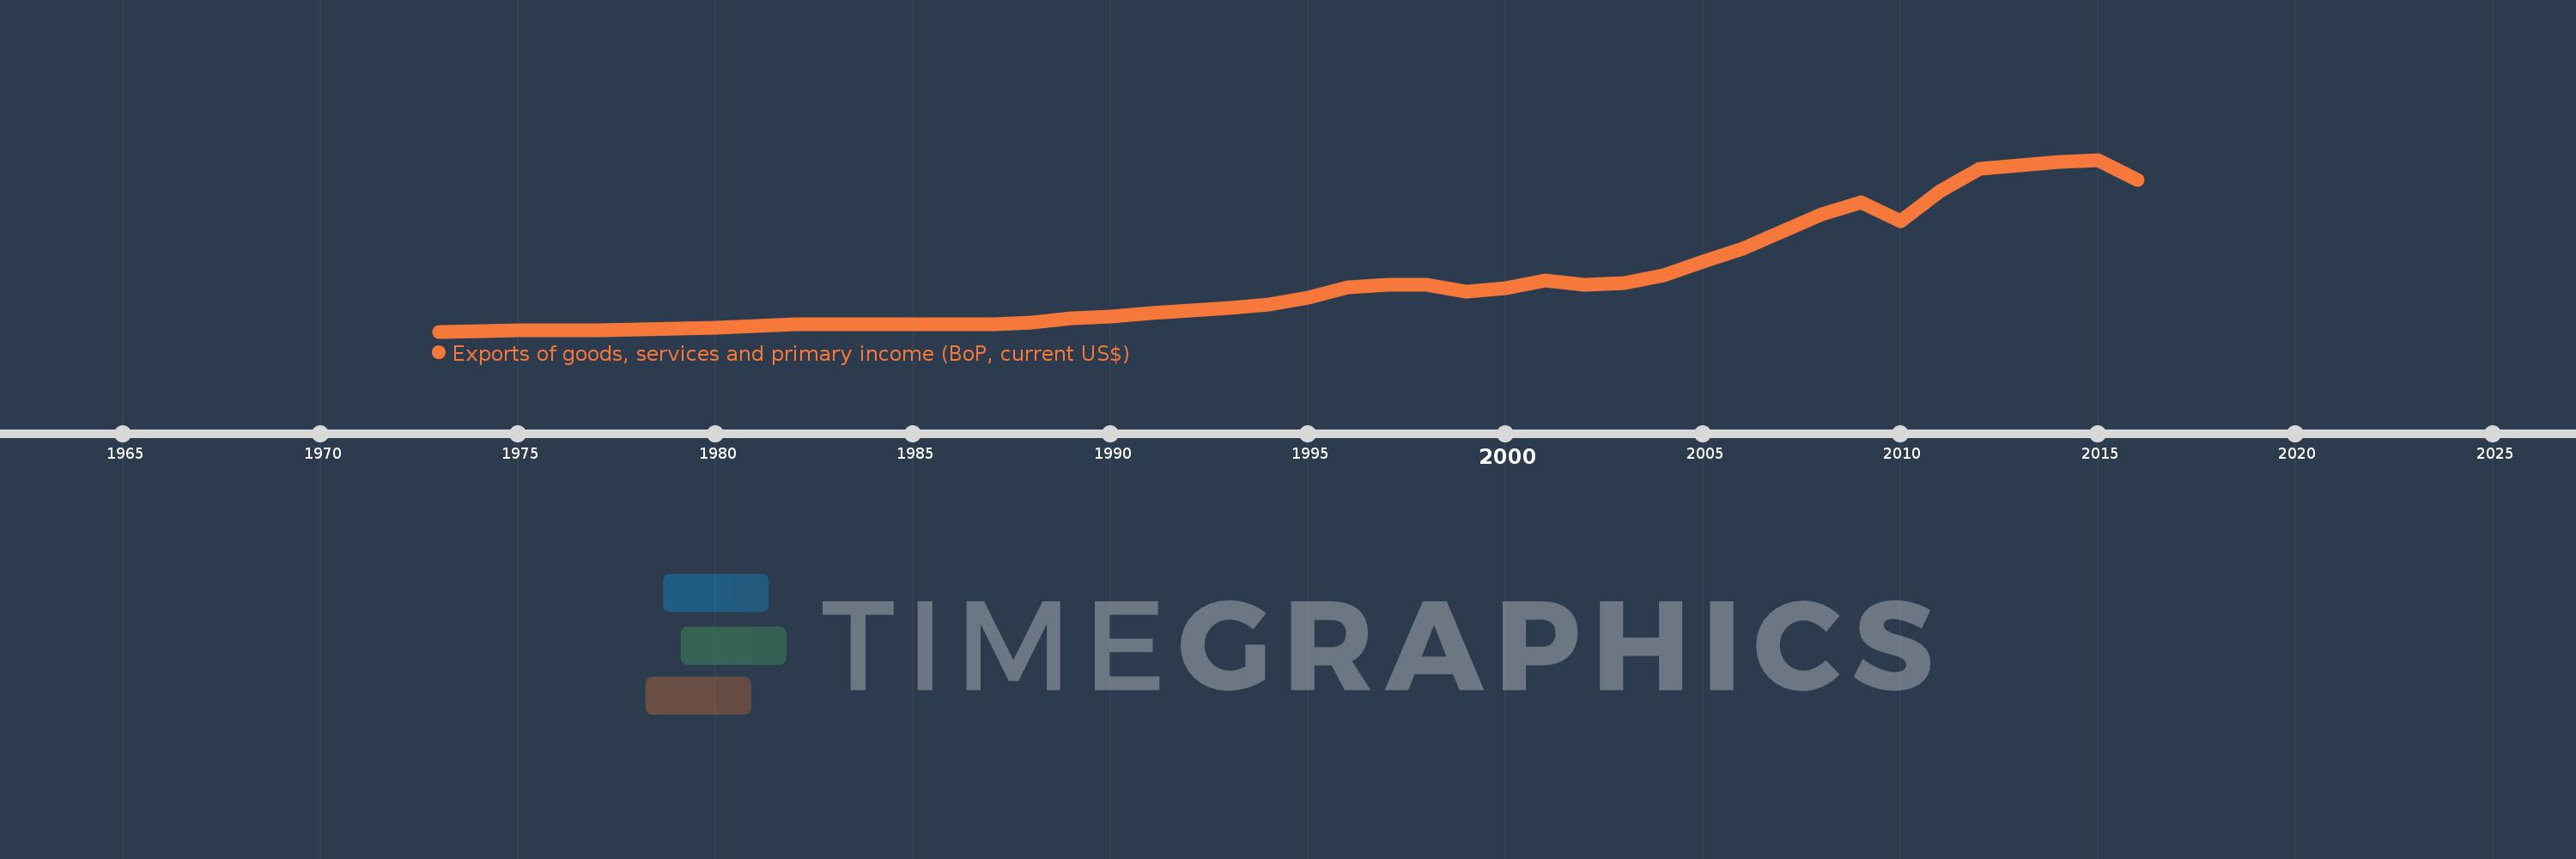
Exports of goods, services and primary income (BoP, current US$)
2016,2015,2014,2013,2012,2011,2010,2009,2008,2007,2006,2005,2004,2003,2002,2001,2000,1999,1998,1997,1996,1995,1994,1993,1992,1991,1990,1989,1988,1987,1986,1985,1984,1983,1982,1981,1980,1979,1978,1977,1976,1975,1974,1973
Estas estadísticas en otros países:
AfghanistanAlbaniaAlgeriaAngolaAntigua and BarbudaArab WorldArgentinaArmeniaArubaAustraliaAustriaAzerbaijanBahamas, TheBahrainBangladeshBarbadosBelarusBelgiumBelizeBeninBermudaBhutanBoliviaBosnia and HerzegovinaBotswanaBrazilBrunei DarussalamBulgariaBurkina FasoBurundiCabo VerdeCambodiaCameroonCanadaCaribbean small statesCentral African RepublicCentral Europe and the BalticsChadChileChinaColombiaComorosCongo, Dem. Rep.Congo, Rep.Costa RicaCote d'IvoireCroatiaCuracaoCyprusCzech RepublicDenmarkDjiboutiDominicaDominican RepublicEarly-demographic dividendEast Asia & PacificEast Asia & Pacific (excluding high income)East Asia & Pacific (IDA & IBRD countries)EcuadorEgypt, Arab Rep.El SalvadorEquatorial GuineaEritreaEstoniaEthiopiaEuro areaEurope & Central AsiaEurope & Central Asia (excluding high income)Europe & Central Asia (IDA & IBRD countries)European UnionFaroe IslandsFijiFinlandFragile and conflict affected situationsFranceFrench PolynesiaGabonGambia, TheGeorgiaGermanyGhanaGreeceGrenadaGuatemalaGuineaGuinea-BissauGuyanaHaitiHeavily indebted poor countries (HIPC)High incomeHondurasHong Kong SAR, ChinaHungaryIBRD onlyIcelandIDA & IBRD totalIDA blendIDA onlyIDA totalIndiaIndonesiaIran, Islamic Rep.IraqIrelandIsraelItalyJamaicaJapanJordanKazakhstanKenyaKiribatiKorea, Rep.KosovoKuwaitKyrgyz RepublicLao PDRLate-demographic dividendLatin America & Caribbean Latin America & Caribbean (excluding high income)Latin America & the Caribbean (IDA & IBRD countries)LatviaLeast developed countries: UN classificationLebanonLesothoLiberiaLibyaLithuaniaLow & middle incomeLow incomeLower middle incomeLuxembourgMacao SAR, ChinaMacedonia, FYRMadagascarMalawiMalaysiaMaldivesMaliMaltaMarshall IslandsMauritaniaMauritiusMexicoMicronesia, Fed. Sts.Middle East & North Africa (excluding high income)Middle East & North Africa (IDA & IBRD countries)Middle incomeMoldovaMongoliaMontenegroMoroccoMozambiqueMyanmarNamibiaNepalNetherlandsNew CaledoniaNicaraguaNigerNigeriaNorth AmericaNorwayOECD membersOmanPacific island small statesPakistanPalauPanamaPapua New GuineaParaguayPeruPhilippinesPolandPortugalPost-demographic dividendPre-demographic dividendQatarRomaniaRussian FederationRwandaSamoaSao Tome and PrincipeSaudi ArabiaSenegalSerbiaSeychellesSierra LeoneSingaporeSint Maarten (Dutch part)Slovak RepublicSloveniaSolomon IslandsSouth AfricaSouth AsiaSouth Asia (IDA & IBRD)South SudanSpainSri LankaSt. Kitts and NevisSt. LuciaSt. Vincent and the GrenadinesSub-Saharan Africa Sub-Saharan Africa (excluding high income)Sub-Saharan Africa (IDA & IBRD countries)SudanSurinameSwazilandSwedenSwitzerlandSyrian Arab RepublicTajikistanTanzaniaThailandTimor-LesteTogoTongaTrinidad and TobagoTunisiaTurkeyTuvaluUgandaUkraineUnited KingdomUnited StatesUpper middle incomeUruguayVanuatuVenezuela, RBVietnamWest Bank and GazaWorldYemen, Rep.ZambiaZimbabwe línea de tiempo (timeline):
En esta escala de tiempo se presenta un gráfico de 1973 y 2016 de Singapore. Los datos de 1972 están ausentes. El número de observaciones reales por fecha: 44.
Fuente (nombre):
Indicadores del desarrollo mundial
Fuente (organización):
International Monetary Fund, Balance of Payments Statistics Yearbook and data files.
Categorías:
Economy & Growth, External Debt, Trade
Se ha actualizado:
23 abr 2017 año
Los indicadores de los cambios de valor en los últimos años
Mínimo:
3.243 bn
1 ene 1973 año
Máximo:
651.872 bn
1 ene 2015 año
A la fecha de observación
Valor
Cambio absoluto
El cambio con respecto al valor anterior
1 ene 1973 año
3.243 bn
+3.243 bn
0.0%
1 ene 1974 año
5.143 bn
+1.9 bn
58.58%
1 ene 1975 año
8.062 bn
+2.919 bn
56.75%
1 ene 1976 año
8.276 bn
+214.481 millones
2.66%
1 ene 1977 año
9.387 bn
+1.111 bn
13.42%
1 ene 1978 año
11.231 bn
+1.844 bn
19.64%
1 ene 1979 año
13.778 bn
+2.547 bn
22.68%
1 ene 1980 año
18.649 bn
+4.871 bn
35.35%
1 ene 1981 año
25.239 bn
+6.59 bn
35.34%
1 ene 1982 año
29.366 bn
+4.128 bn
16.36%
1 ene 1983 año
30.386 bn
+1.02 bn
3.47%
1 ene 1984 año
31.029 bn
+642.988 millones
2.12%
1 ene 1985 año
31.847 bn
+817.776 millones
2.64%
1 ene 1986 año
29.729 bn
-2.118 bn
-6.65%
1 ene 1987 año
29.774 bn
+45.392 millones
0.15%
1 ene 1988 año
37.811 bn
+8.037 bn
26.99%
1 ene 1989 año
52.148 bn
+14.337 bn
37.92%
1 ene 1990 año
60.11 bn
+7.962 bn
15.27%
1 ene 1991 año
73.998 bn
+13.887 bn
23.1%
1 ene 1992 año
82.714 bn
+8.717 bn
11.78%
1 ene 1993 año
90.98 bn
+8.265 bn
9.99%
1 ene 1994 año
104.53 bn
+13.55 bn
14.89%
1 ene 1995 año
130.746 bn
+26.216 bn
25.08%
1 ene 1996 año
170.437 bn
+39.691 bn
30.36%
1 ene 1997 año
179.995 bn
+9.558 bn
5.61%
1 ene 1998 año
181.309 bn
+1.314 bn
0.73%
1 ene 1999 año
154.351 bn
-26.957 bn
-14.87%
1 ene 2000 año
168.275 bn
+13.923 bn
9.02%
1 ene 2001 año
196.633 bn
+28.358 bn
16.85%
1 ene 2002 año
178.887 bn
-17.746 bn
-9.02%
1 ene 2003 año
184.915 bn
+6.028 bn
3.37%
1 ene 2004 año
216.062 bn
+31.147 bn
16.84%
1 ene 2005 año
268.361 bn
+52.299 bn
24.21%
1 ene 2006 año
317.269 bn
+48.908 bn
18.22%
1 ene 2007 año
381.055 bn
+63.787 bn
20.1%
1 ene 2008 año
444.87 bn
+63.815 bn
16.75%
1 ene 2009 año
490.594 bn
+45.725 bn
10.28%
1 ene 2010 año
419.391 bn
-71.204 bn
-14.51%
1 ene 2011 año
533.709 bn
+114.318 bn
27.26%
1 ene 2012 año
618.696 bn
+84.987 bn
15.92%
1 ene 2013 año
629.741 bn
+11.046 bn
1.79%
1 ene 2014 año
644.501 bn
+14.76 bn
2.34%
1 ene 2015 año
651.872 bn
+7.371 bn
1.14%
1 ene 2016 año
575.499 bn
-76.373 bn
-11.72%
Ranking de los países por los datos estadísticos actuales


Comentarios: