29
/es/
es
AIzaSyAYiBZKx7MnpbEhh9jyipgxe19OcubqV5w
April 1, 2024
30631
Europe & Central Asia
ECS
false
2
1
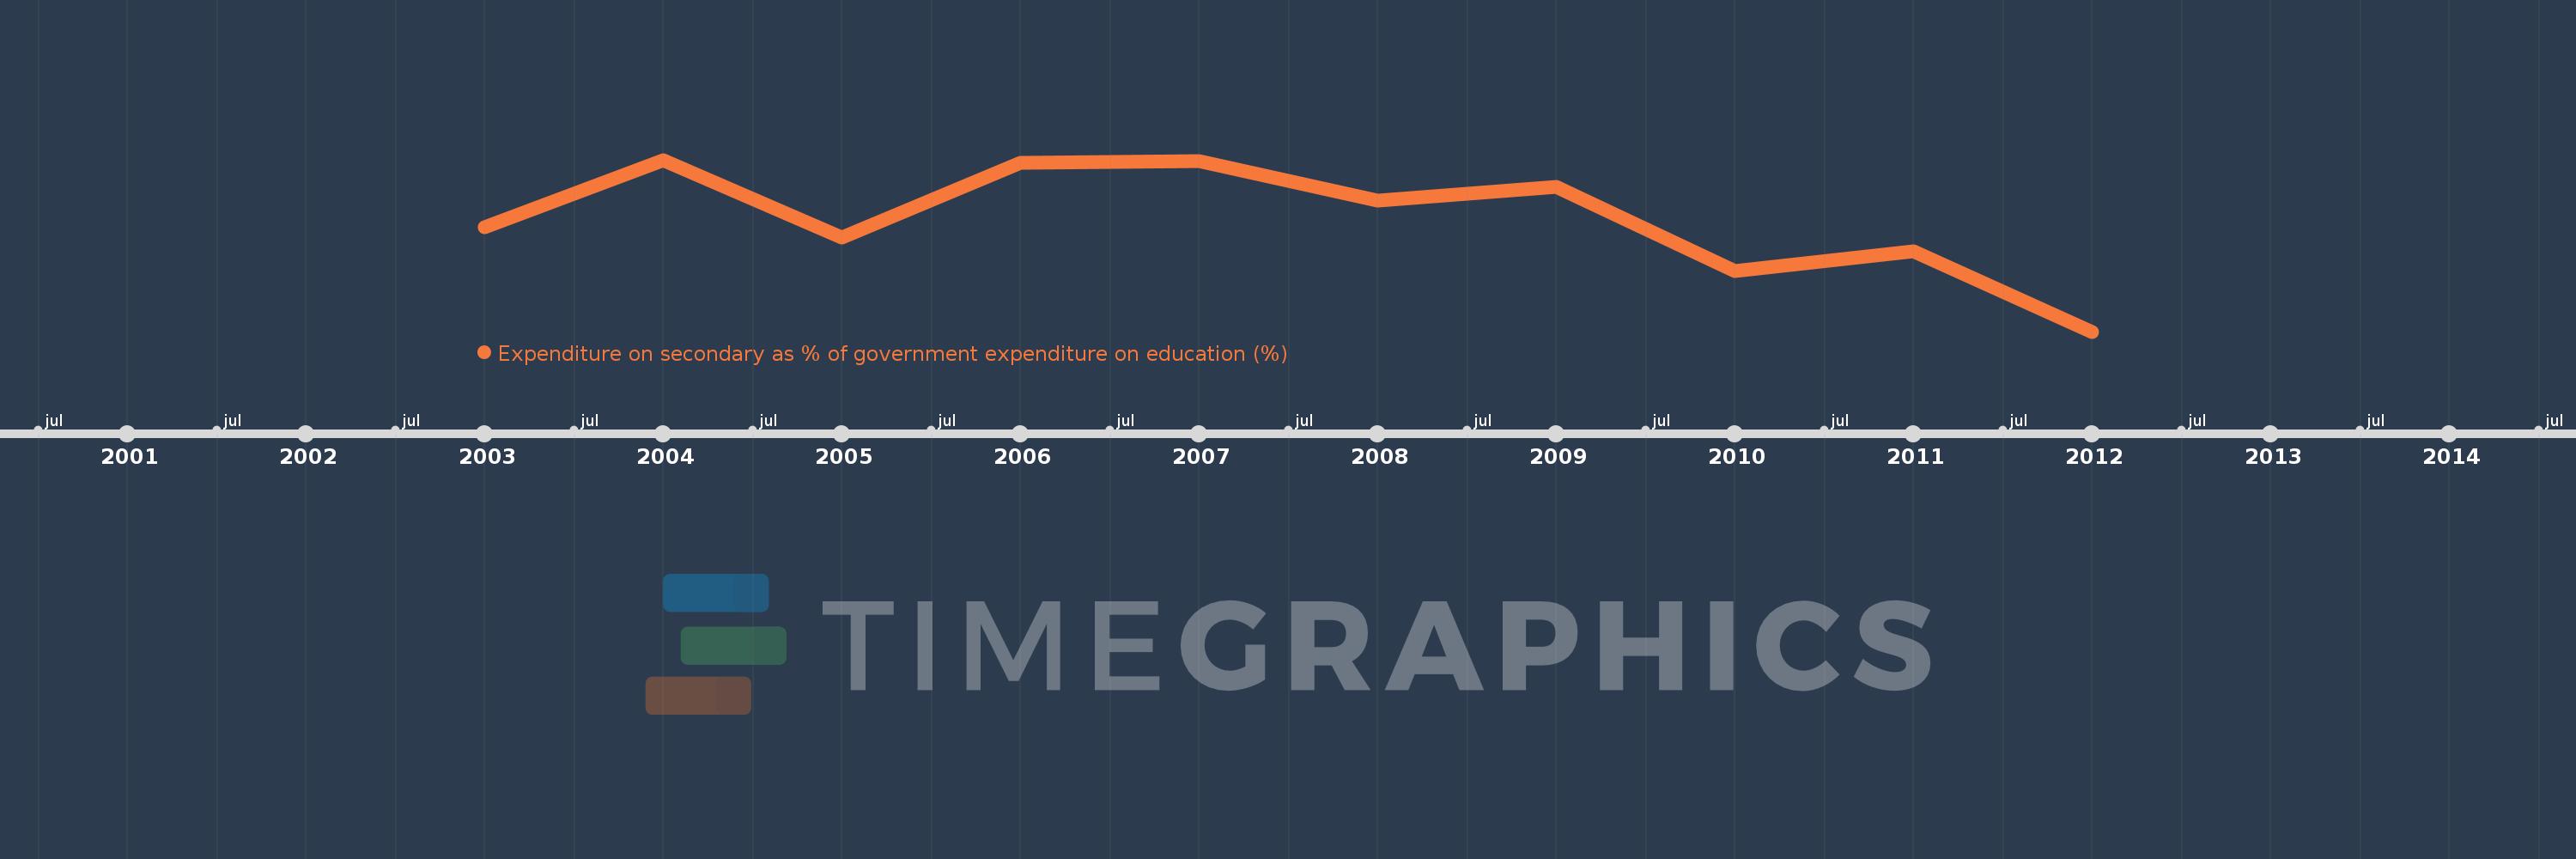
Expenditure on secondary as % of government expenditure on education (%)
2012,2011,2010,2009,2008,2007,2006,2005,2004,2003
Estas estadísticas en otros países:
línea de tiempo (timeline):
En esta escala de tiempo se presenta un gráfico de 2003 y 2012 de Europe & Central Asia. Los datos de 2002 están ausentes. El número de observaciones reales por fecha: 10.
Fuente (nombre):
Indicadores del desarrollo mundial
Fuente (organización):
UNESCO Institute for Statistics
Categorías:
Education
Se ha actualizado:
23 abr 2017 año
Los indicadores de los cambios de valor en los últimos años
Mínimo:
39.591
1 ene 2012 año
Máximo:
42.561
1 ene 2004 año
A la fecha de observación
Valor
Cambio absoluto
El cambio con respecto al valor anterior
1 ene 2003 año
41.391
+41.391
0.0%
1 ene 2004 año
42.561
+1.169
2.83%
1 ene 2005 año
41.223
-1.338
-3.14%
1 ene 2006 año
42.516
+1.294
3.14%
1 ene 2007 año
42.533
+0.017
0.04%
1 ene 2008 año
41.862
-0.671
-1.58%
1 ene 2009 año
42.093
+0.231
0.55%
1 ene 2010 año
40.64
-1.453
-3.45%
1 ene 2011 año
40.975
+0.336
0.83%
1 ene 2012 año
39.591
-1.384
-3.38%
Ranking de los países por los datos estadísticos actuales


Comentarios: