29
/es/
es
AIzaSyAYiBZKx7MnpbEhh9jyipgxe19OcubqV5w
April 1, 2024
247477
Spain
ESP
true
2
1
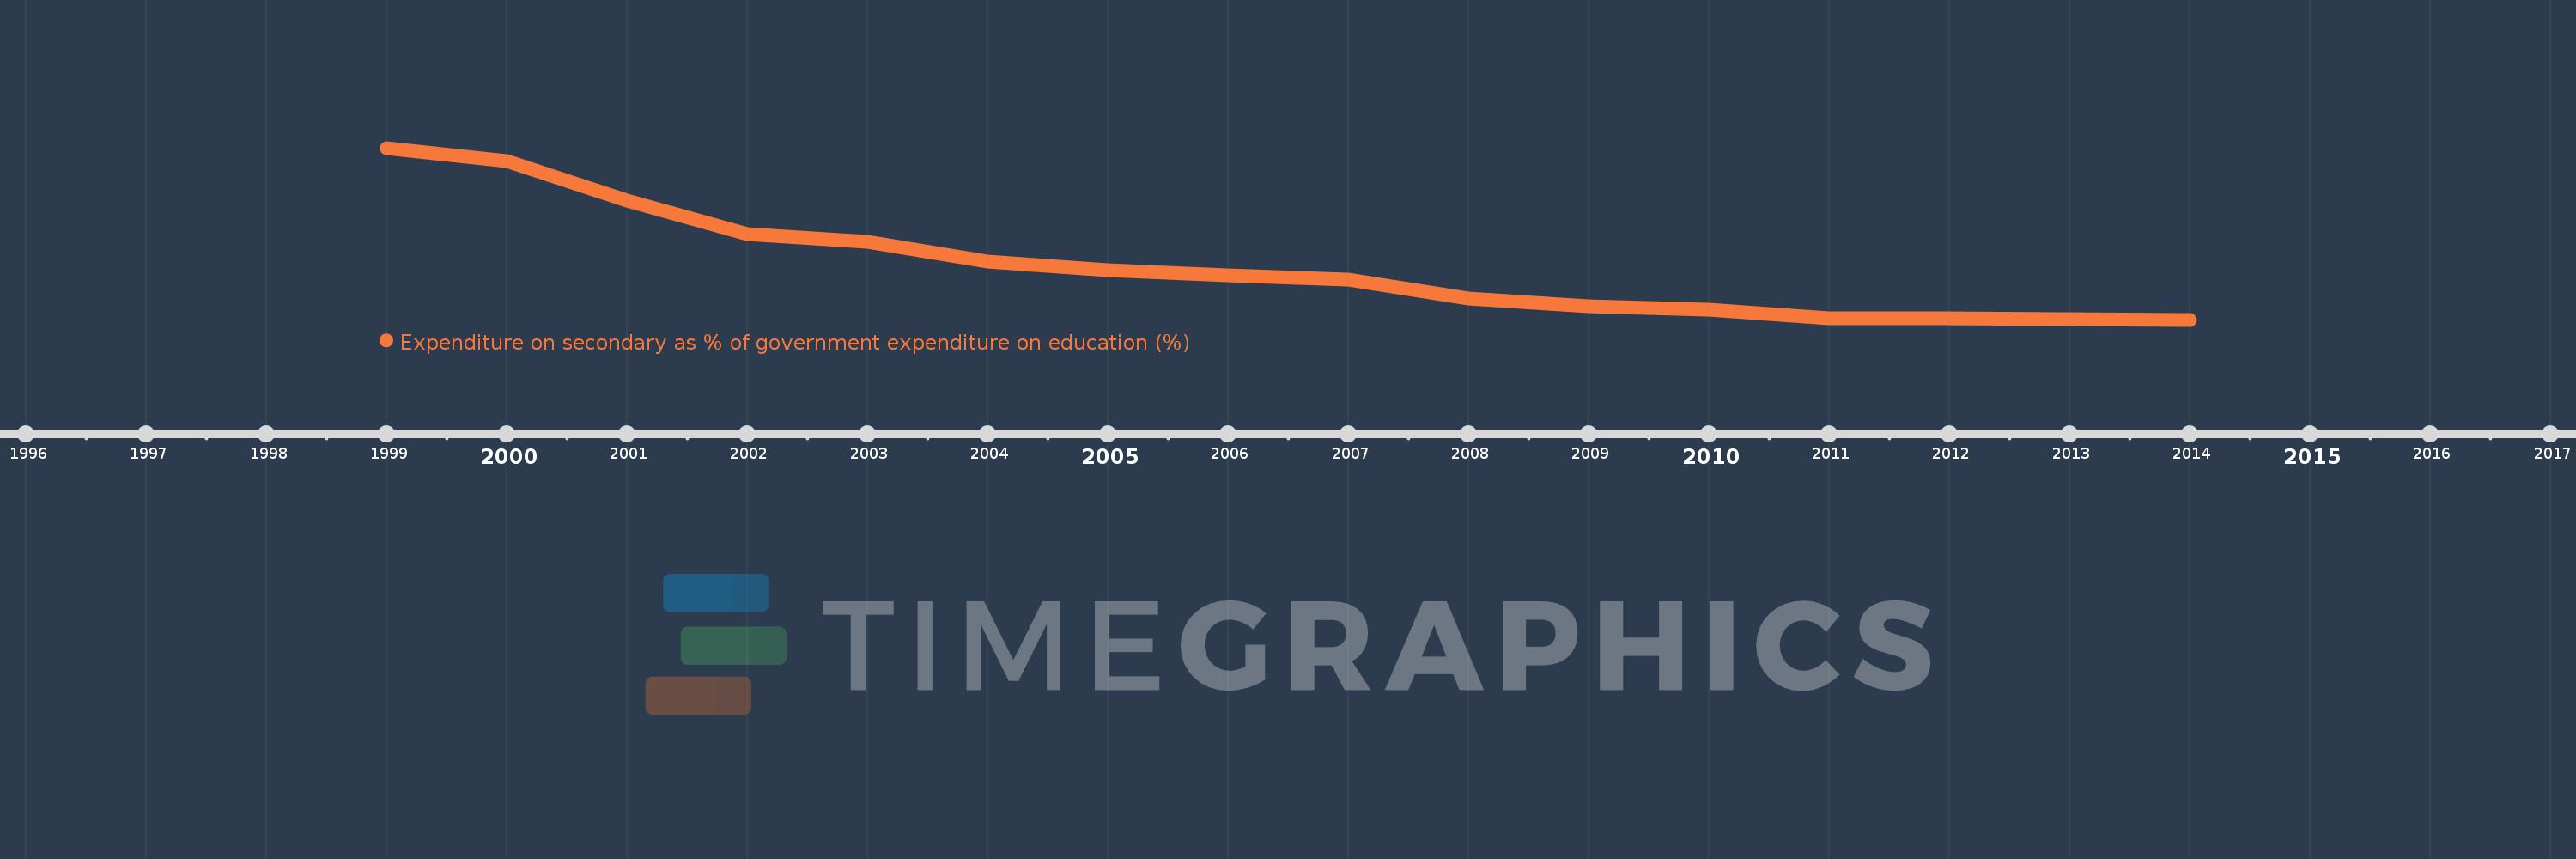
Expenditure on secondary as % of government expenditure on education (%)
2014,2012,2011,2010,2009,2008,2007,2006,2005,2004,2003,2002,2001,2000,1999
Estas estadísticas en otros países:
línea de tiempo (timeline):
En esta escala de tiempo se presenta un gráfico de 1999 y 2014 de Spain. Los datos de 1998 están ausentes. El número de observaciones reales por fecha: 15.
Fuente (nombre):
Indicadores del desarrollo mundial
Fuente (organización):
UNESCO Institute for Statistics
Categorías:
Education
Se ha actualizado:
23 abr 2017 año
Los indicadores de los cambios de valor en los últimos años
Mínimo:
36.906
1 ene 2014 año
Máximo:
46.756
1 ene 1999 año
A la fecha de observación
Valor
Cambio absoluto
El cambio con respecto al valor anterior
1 ene 1999 año
46.756
+46.756
0.0%
1 ene 2000 año
46.023
-0.733
-1.57%
1 ene 2001 año
43.745
-2.278
-4.95%
1 ene 2002 año
41.816
-1.929
-4.41%
1 ene 2003 año
41.391
-0.424
-1.01%
1 ene 2004 año
40.255
-1.136
-2.75%
1 ene 2005 año
39.74
-0.515
-1.28%
1 ene 2006 año
39.451
-0.289
-0.73%
1 ene 2007 año
39.204
-0.247
-0.63%
1 ene 2008 año
38.128
-1.075
-2.74%
1 ene 2009 año
37.659
-0.469
-1.23%
1 ene 2010 año
37.501
-0.158
-0.42%
1 ene 2011 año
36.971
-0.53
-1.41%
1 ene 2012 año
36.971
0.0
0.0%
1 ene 2014 año
36.906
-0.065
-0.18%
Ranking de los países por los datos estadísticos actuales


Comentarios: