29
/es/
es
AIzaSyAYiBZKx7MnpbEhh9jyipgxe19OcubqV5w
April 1, 2024
163696
Japan
JPN
true
2
1
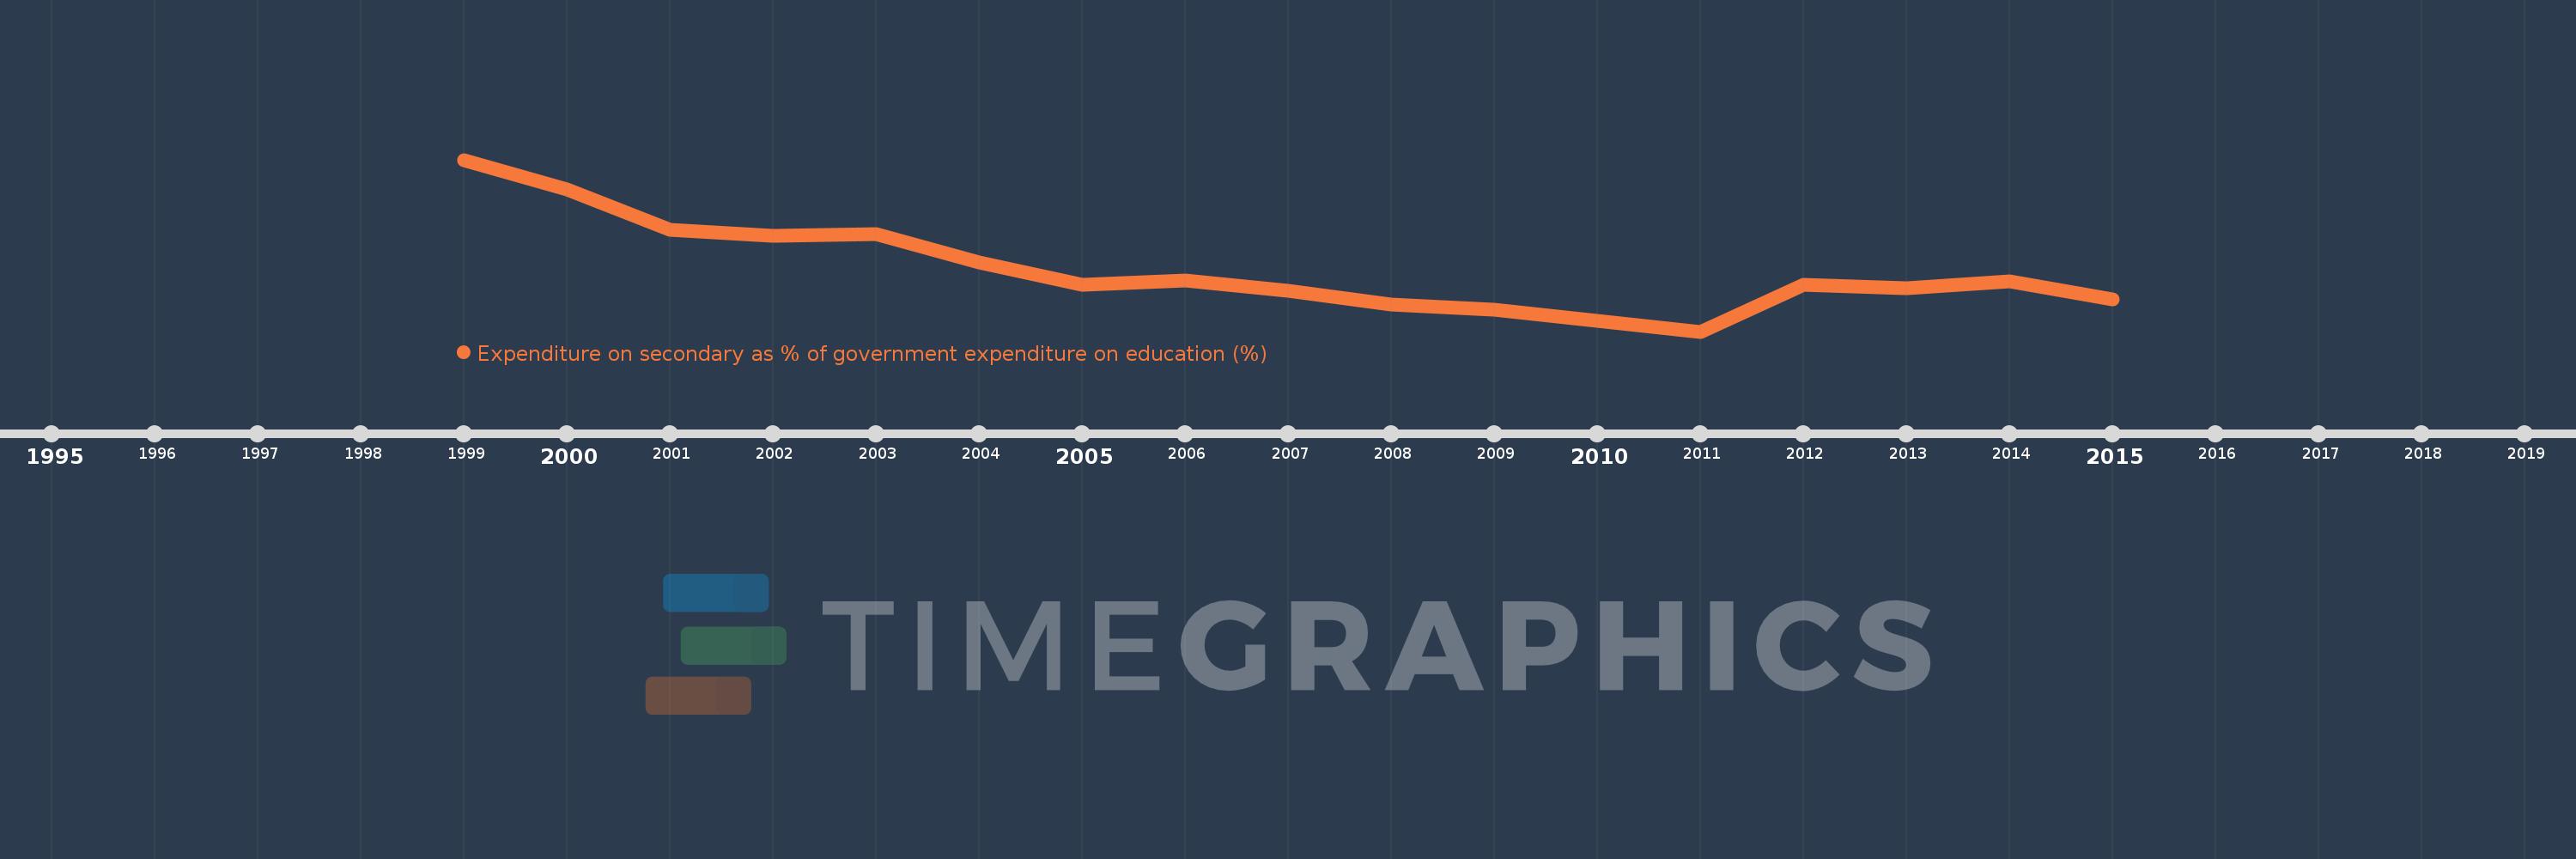
Expenditure on secondary as % of government expenditure on education (%)
2015,2014,2013,2012,2011,2009,2008,2007,2006,2005,2004,2003,2002,2001,2000,1999
Estas estadísticas en otros países:
línea de tiempo (timeline):
En esta escala de tiempo se presenta un gráfico de 1999 y 2015 de Japan. Los datos de 1998 están ausentes. El número de observaciones reales por fecha: 16.
Fuente (nombre):
Indicadores del desarrollo mundial
Fuente (organización):
UNESCO Institute for Statistics
Categorías:
Education
Se ha actualizado:
23 abr 2017 año
Los indicadores de los cambios de valor en los últimos años
Mínimo:
36.789
1 ene 2011 año
Máximo:
42.146
1 ene 1999 año
A la fecha de observación
Valor
Cambio absoluto
El cambio con respecto al valor anterior
1 ene 1999 año
42.146
+42.146
0.0%
1 ene 2000 año
41.227
-0.919
-2.18%
1 ene 2001 año
39.959
-1.268
-3.08%
1 ene 2002 año
39.784
-0.175
-0.44%
1 ene 2003 año
39.82
+0.036
0.09%
1 ene 2004 año
38.952
-0.868
-2.18%
1 ene 2005 año
38.262
-0.69
-1.77%
1 ene 2006 año
38.372
+0.11
0.29%
1 ene 2007 año
38.07
-0.302
-0.79%
1 ene 2008 año
37.62
-0.45
-1.18%
1 ene 2009 año
37.467
-0.153
-0.41%
1 ene 2011 año
36.789
-0.678
-1.81%
1 ene 2012 año
38.243
+1.454
3.95%
1 ene 2013 año
38.147
-0.097
-0.25%
1 ene 2014 año
38.367
+0.221
0.58%
1 ene 2015 año
37.805
-0.563
-1.47%
Ranking de los países por los datos estadísticos actuales


Comentarios: