29
/es/
es
AIzaSyAYiBZKx7MnpbEhh9jyipgxe19OcubqV5w
April 1, 2024
147878
Guyana
GUY
true
2
1
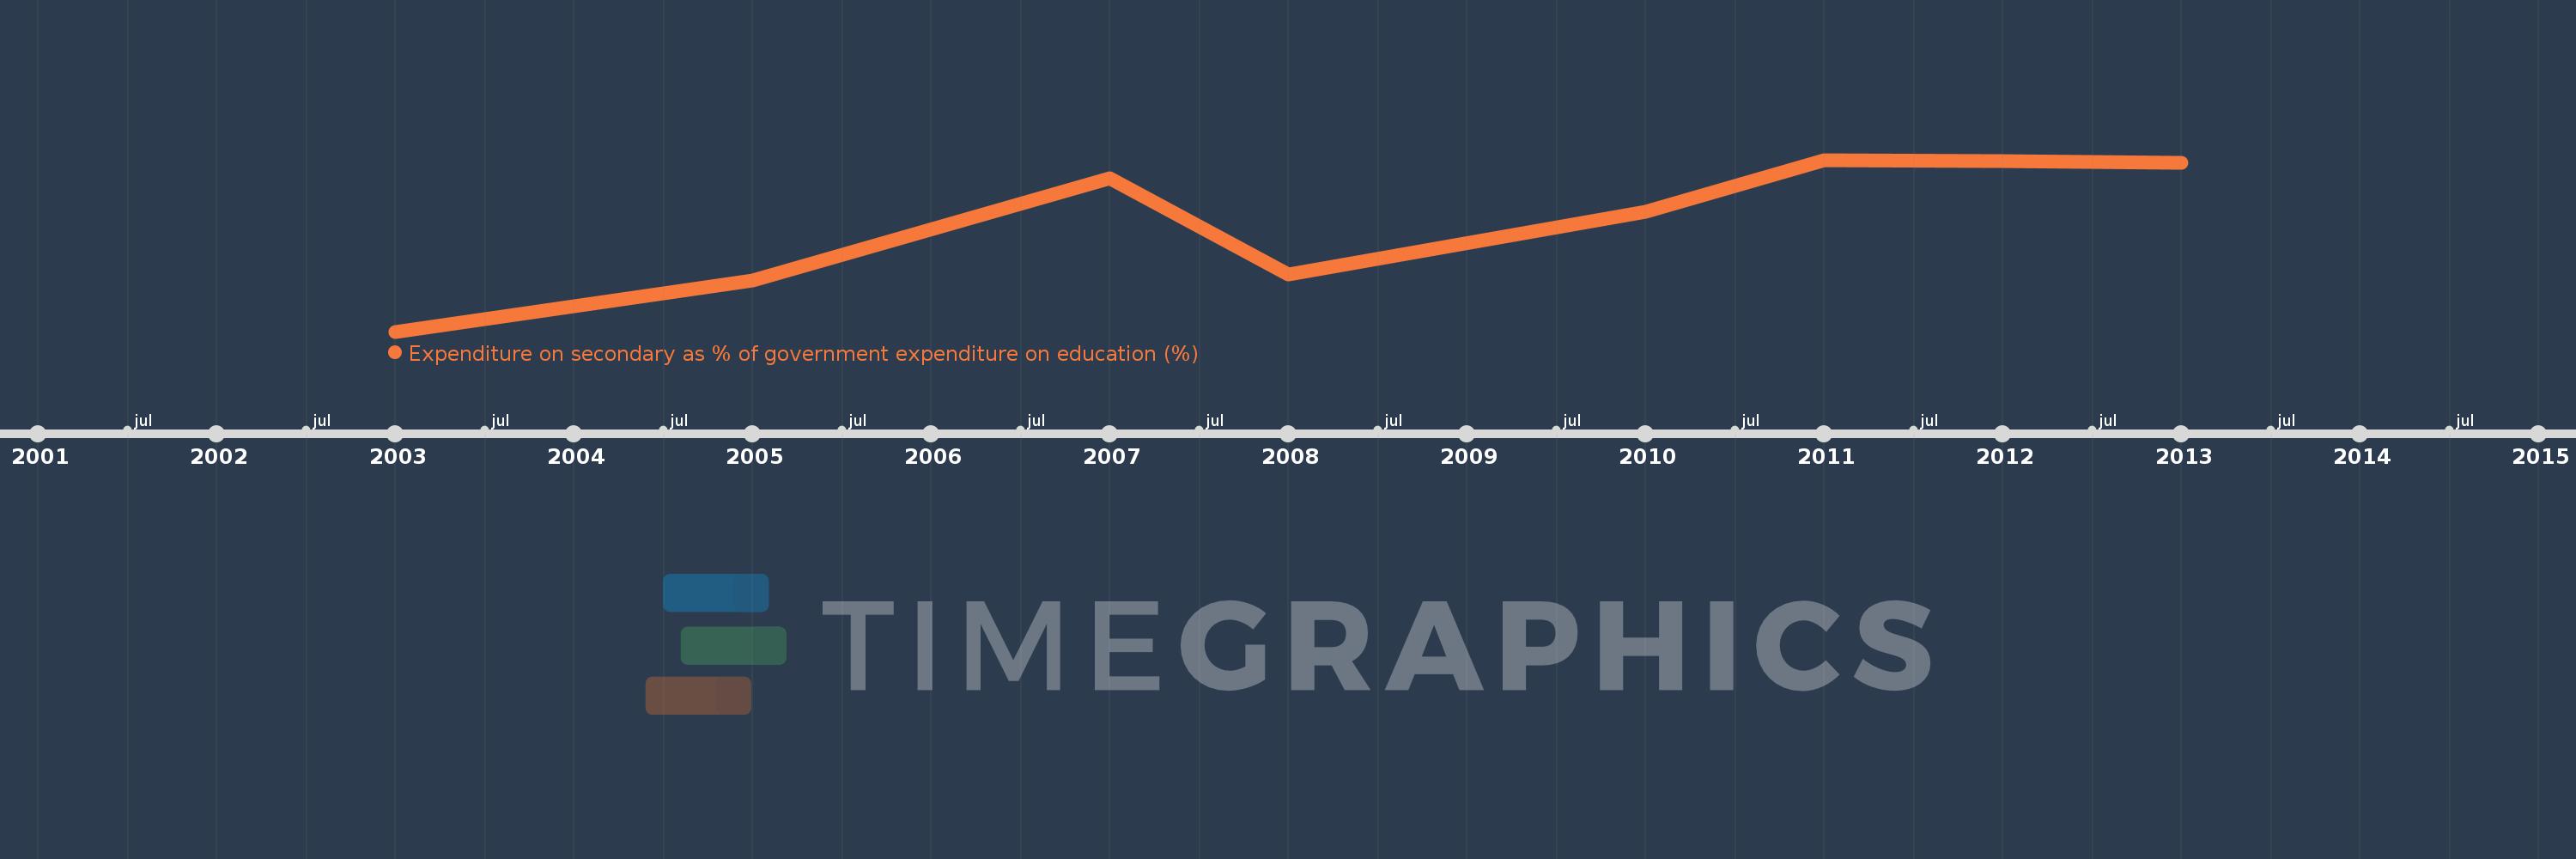
Expenditure on secondary as % of government expenditure on education (%)
2013,2012,2011,2010,2008,2007,2005,2003
Estas estadísticas en otros países:
línea de tiempo (timeline):
En esta escala de tiempo se presenta un gráfico de 2003 y 2013 de Guyana. Los datos de 2002 están ausentes. El número de observaciones reales por fecha: 8.
Fuente (nombre):
Indicadores del desarrollo mundial
Fuente (organización):
UNESCO Institute for Statistics
Categorías:
Education
Se ha actualizado:
23 abr 2017 año
Los indicadores de los cambios de valor en los últimos años
Mínimo:
23.514
1 ene 2003 año
Máximo:
33.439
1 ene 2011 año
A la fecha de observación
Valor
Cambio absoluto
El cambio con respecto al valor anterior
1 ene 2003 año
23.514
+23.514
0.0%
1 ene 2005 año
26.48
+2.966
12.61%
1 ene 2007 año
32.352
+5.872
22.18%
1 ene 2008 año
26.83
-5.522
-17.07%
1 ene 2010 año
30.431
+3.601
13.42%
1 ene 2011 año
33.439
+3.008
9.88%
1 ene 2012 año
33.377
-0.062
-0.18%
1 ene 2013 año
33.251
-0.126
-0.38%
Ranking de los países por los datos estadísticos actuales


Comentarios: