29
/es/
es
AIzaSyAYiBZKx7MnpbEhh9jyipgxe19OcubqV5w
April 1, 2024
30088
Euro area
EMU
false
2
1
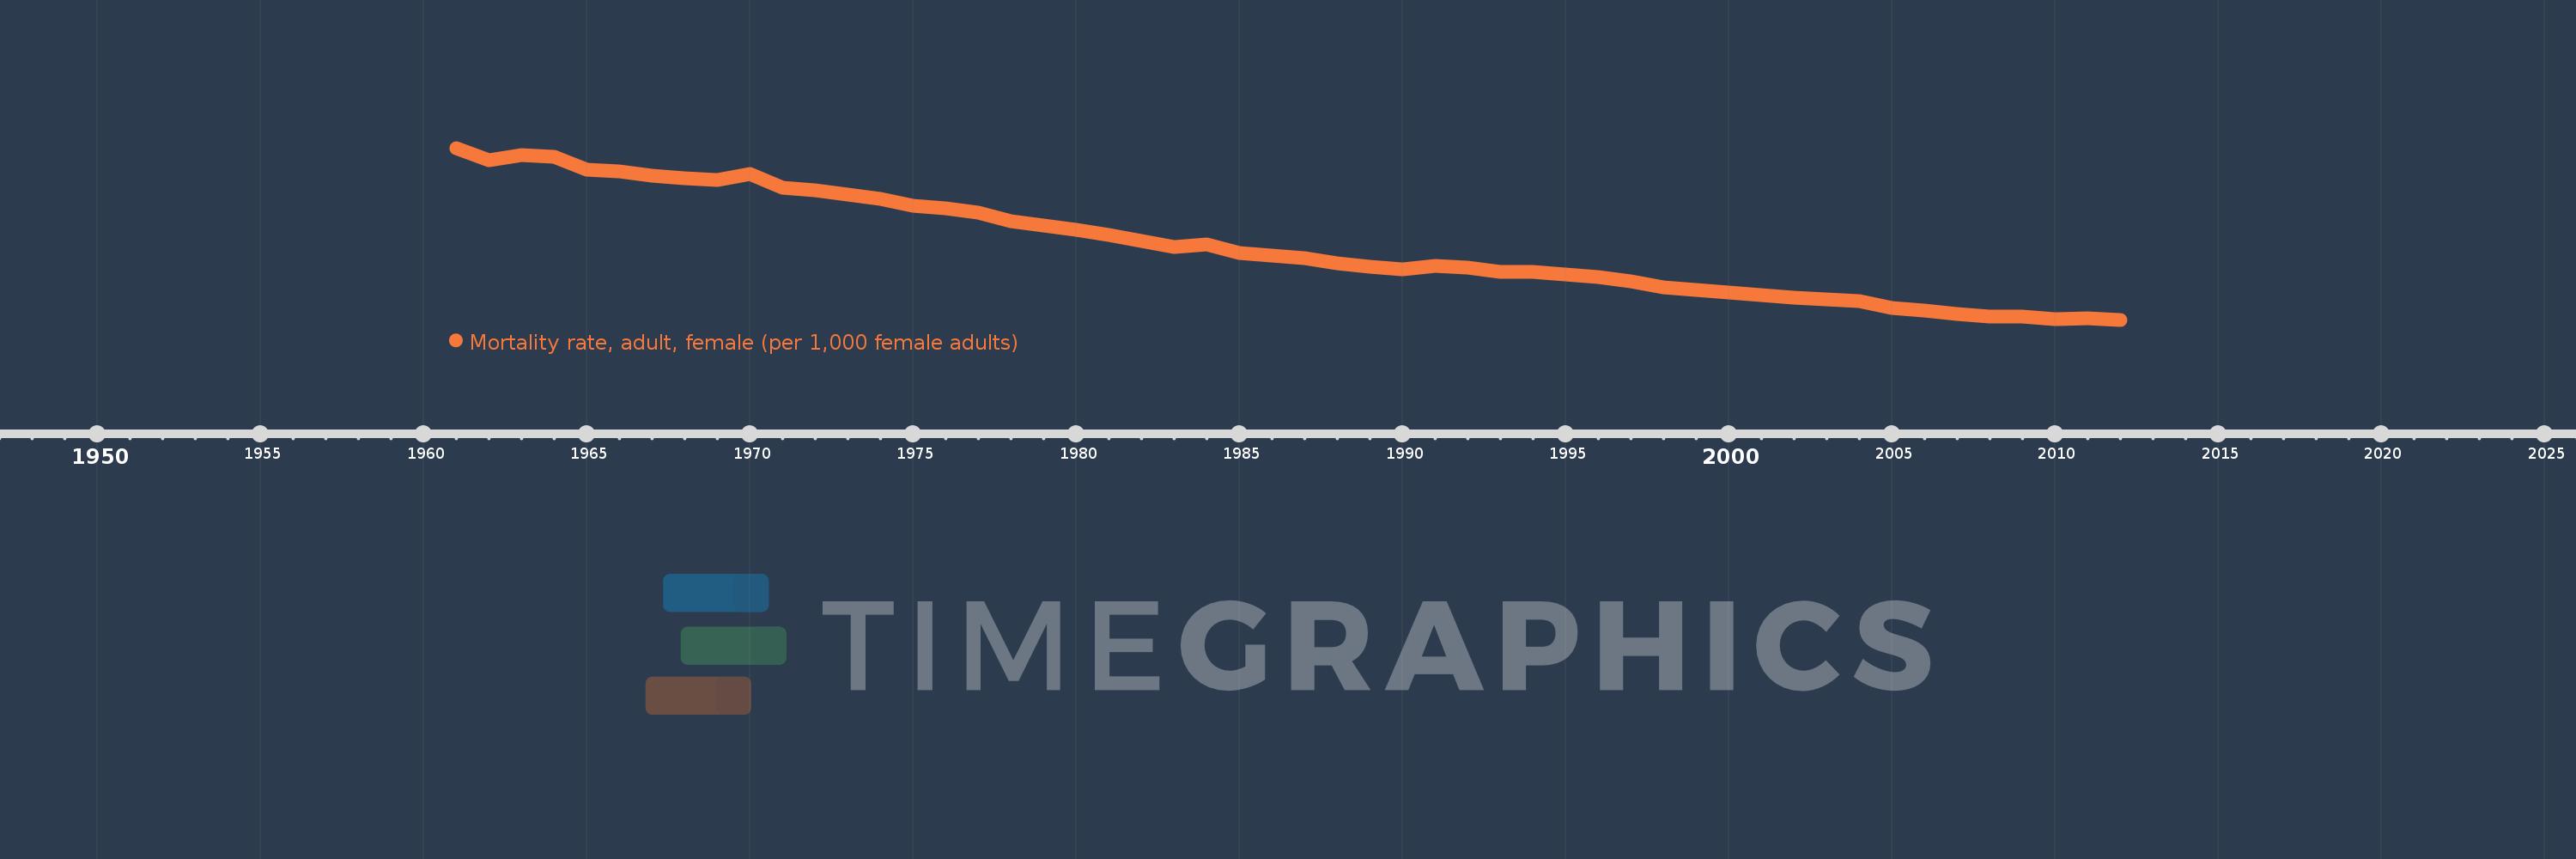
Mortality rate, adult, female (per 1,000 female adults)
2012,2011,2010,2009,2008,2007,2006,2005,2004,2003,2002,2001,2000,1999,1998,1997,1996,1995,1994,1993,1992,1991,1990,1989,1988,1987,1986,1985,1984,1983,1982,1981,1980,1979,1978,1977,1976,1975,1974,1973,1972,1971,1970,1969,1968,1967,1966,1965,1964,1963,1962,1961
Estas estadísticas en otros países:
AfghanistanAlbaniaAlgeriaAngolaAntigua and BarbudaArab WorldArgentinaArmeniaArubaAustraliaAustriaAzerbaijanBahamas, TheBahrainBangladeshBarbadosBelarusBelgiumBelizeBeninBhutanBoliviaBosnia and HerzegovinaBotswanaBrazilBrunei DarussalamBulgariaBurkina FasoBurundiCabo VerdeCambodiaCameroonCanadaCaribbean small statesCentral African RepublicCentral Europe and the BalticsChadChannel IslandsChileChinaColombiaComorosCongo, Dem. Rep.Congo, Rep.Costa RicaCote d'IvoireCroatiaCubaCuracaoCyprusCzech RepublicDenmarkDjiboutiDominicaDominican RepublicEarly-demographic dividendEast Asia & PacificEast Asia & Pacific (excluding high income)East Asia & Pacific (IDA & IBRD countries)EcuadorEgypt, Arab Rep.El SalvadorEquatorial GuineaEritreaEstoniaEthiopiaEuro areaEurope & Central AsiaEurope & Central Asia (excluding high income)Europe & Central Asia (IDA & IBRD countries)European UnionFijiFinlandFragile and conflict affected situationsFranceFrench PolynesiaGabonGambia, TheGeorgiaGermanyGhanaGreeceGreenlandGrenadaGuamGuatemalaGuineaGuinea-BissauGuyanaHaitiHeavily indebted poor countries (HIPC)High incomeHondurasHong Kong SAR, ChinaHungaryIBRD onlyIcelandIDA & IBRD totalIDA blendIDA onlyIDA totalIndiaIndonesiaIran, Islamic Rep.IraqIrelandIsraelItalyJamaicaJapanJordanKazakhstanKenyaKiribatiKorea, Dem. People’s Rep.Korea, Rep.KuwaitKyrgyz RepublicLao PDRLate-demographic dividendLatin America & Caribbean Latin America & Caribbean (excluding high income)Latin America & the Caribbean (IDA & IBRD countries)LatviaLeast developed countries: UN classificationLebanonLesothoLiberiaLibyaLithuaniaLow & middle incomeLow incomeLower middle incomeLuxembourgMacao SAR, ChinaMacedonia, FYRMadagascarMalawiMalaysiaMaldivesMaliMaltaMarshall IslandsMauritaniaMauritiusMexicoMicronesia, Fed. Sts.Middle East & North AfricaMiddle East & North Africa (excluding high income)Middle East & North Africa (IDA & IBRD countries)Middle incomeMoldovaMongoliaMontenegroMoroccoMozambiqueMyanmarNamibiaNepalNetherlandsNew CaledoniaNew ZealandNicaraguaNigerNigeriaNorth AmericaNorwayOECD membersOmanOther small statesPacific island small statesPakistanPanamaPapua New GuineaParaguayPeruPhilippinesPolandPortugalPost-demographic dividendPre-demographic dividendPuerto RicoQatarRomaniaRussian FederationRwandaSamoaSao Tome and PrincipeSaudi ArabiaSenegalSerbiaSeychellesSierra LeoneSingaporeSlovak RepublicSloveniaSmall statesSolomon IslandsSomaliaSouth AfricaSouth AsiaSouth Asia (IDA & IBRD)South SudanSpainSri LankaSt. Kitts and NevisSt. LuciaSt. Vincent and the GrenadinesSub-Saharan Africa Sub-Saharan Africa (excluding high income)Sub-Saharan Africa (IDA & IBRD countries)SudanSurinameSwazilandSwedenSwitzerlandSyrian Arab RepublicTajikistanTanzaniaThailandTimor-LesteTogoTongaTrinidad and TobagoTunisiaTurkeyTurkmenistanUgandaUkraineUnited Arab EmiratesUnited KingdomUnited StatesUpper middle incomeUruguayUzbekistanVanuatuVenezuela, RBVietnamVirgin Islands (U.S.)West Bank and GazaWorldYemen, Rep.ZambiaZimbabwe línea de tiempo (timeline):
En esta escala de tiempo se presenta un gráfico de 1961 y 2012 de Euro area. Los datos de 1960 están ausentes. El número de observaciones reales por fecha: 52.
Fuente (nombre):
Indicadores del desarrollo mundial
Fuente (organización):
(1) United Nations Population Division. World Population Prospects. New York, United Nations, Department of Economic and Social Affairs (advanced Excel tables). Available at http://esa.un.org/wpp/unpp/panel_population.htm, (2) University of California, Berkeley, and Max Planck Institute for Demographic Research. Human Mortality Database. [ www.mortality.org or www.humanmortality.de].
Categorías:
Health, Gender
Se ha actualizado:
23 abr 2017 año
Los indicadores de los cambios de valor en los últimos años
Mínimo:
51.261
1 ene 2012 año
Máximo:
112.896
1 ene 1961 año
A la fecha de observación
Valor
Cambio absoluto
El cambio con respecto al valor anterior
1 ene 1961 año
112.896
+112.896
0.0%
1 ene 1962 año
108.563
-4.333
-3.84%
1 ene 1963 año
110.312
+1.749
1.61%
1 ene 1964 año
109.611
-0.701
-0.64%
1 ene 1965 año
105.198
-4.412
-4.03%
1 ene 1966 año
104.517
-0.682
-0.65%
1 ene 1967 año
102.884
-1.632
-1.56%
1 ene 1968 año
101.875
-1.009
-0.98%
1 ene 1969 año
101.308
-0.567
-0.56%
1 ene 1970 año
103.434
+2.126
2.1%
1 ene 1971 año
98.629
-4.805
-4.65%
1 ene 1972 año
97.832
-0.797
-0.81%
1 ene 1973 año
96.09
-1.742
-1.78%
1 ene 1974 año
94.756
-1.334
-1.39%
1 ene 1975 año
92.186
-2.57
-2.71%
1 ene 1976 año
91.27
-0.916
-0.99%
1 ene 1977 año
89.804
-1.467
-1.61%
1 ene 1978 año
86.716
-3.088
-3.44%
1 ene 1979 año
85.049
-1.666
-1.92%
1 ene 1980 año
83.536
-1.514
-1.78%
1 ene 1981 año
81.623
-1.912
-2.29%
1 ene 1982 año
79.663
-1.96
-2.4%
1 ene 1983 año
77.507
-2.156
-2.71%
1 ene 1984 año
78.147
+0.64
0.83%
1 ene 1985 año
75.32
-2.827
-3.62%
1 ene 1986 año
74.219
-1.101
-1.46%
1 ene 1987 año
73.208
-1.011
-1.36%
1 ene 1988 año
71.599
-1.609
-2.2%
1 ene 1989 año
70.264
-1.335
-1.86%
1 ene 1990 año
69.504
-0.76
-1.08%
1 ene 1991 año
70.63
+1.126
1.62%
1 ene 1992 año
70.115
-0.515
-0.73%
1 ene 1993 año
68.467
-1.648
-2.35%
1 ene 1994 año
68.56
+0.092
0.13%
1 ene 1995 año
67.414
-1.145
-1.67%
1 ene 1996 año
66.491
-0.923
-1.37%
1 ene 1997 año
65.102
-1.389
-2.09%
1 ene 1998 año
63.021
-2.081
-3.2%
1 ene 1999 año
61.851
-1.17
-1.86%
1 ene 2000 año
60.889
-0.961
-1.55%
1 ene 2001 año
59.974
-0.915
-1.5%
1 ene 2002 año
59.298
-0.677
-1.13%
1 ene 2003 año
58.502
-0.796
-1.34%
1 ene 2004 año
57.859
-0.643
-1.1%
1 ene 2005 año
55.601
-2.258
-3.9%
1 ene 2006 año
54.672
-0.929
-1.67%
1 ene 2007 año
53.309
-1.364
-2.49%
1 ene 2008 año
52.536
-0.772
-1.45%
1 ene 2009 año
52.263
-0.273
-0.52%
1 ene 2010 año
51.509
-0.754
-1.44%
1 ene 2011 año
51.784
+0.275
0.53%
1 ene 2012 año
51.261
-0.523
-1.01%
Ranking de los países por los datos estadísticos actuales


Comentarios: