29
/es/
es
AIzaSyAYiBZKx7MnpbEhh9jyipgxe19OcubqV5w
April 1, 2024
256618
Sweden
SWE
true
2
1
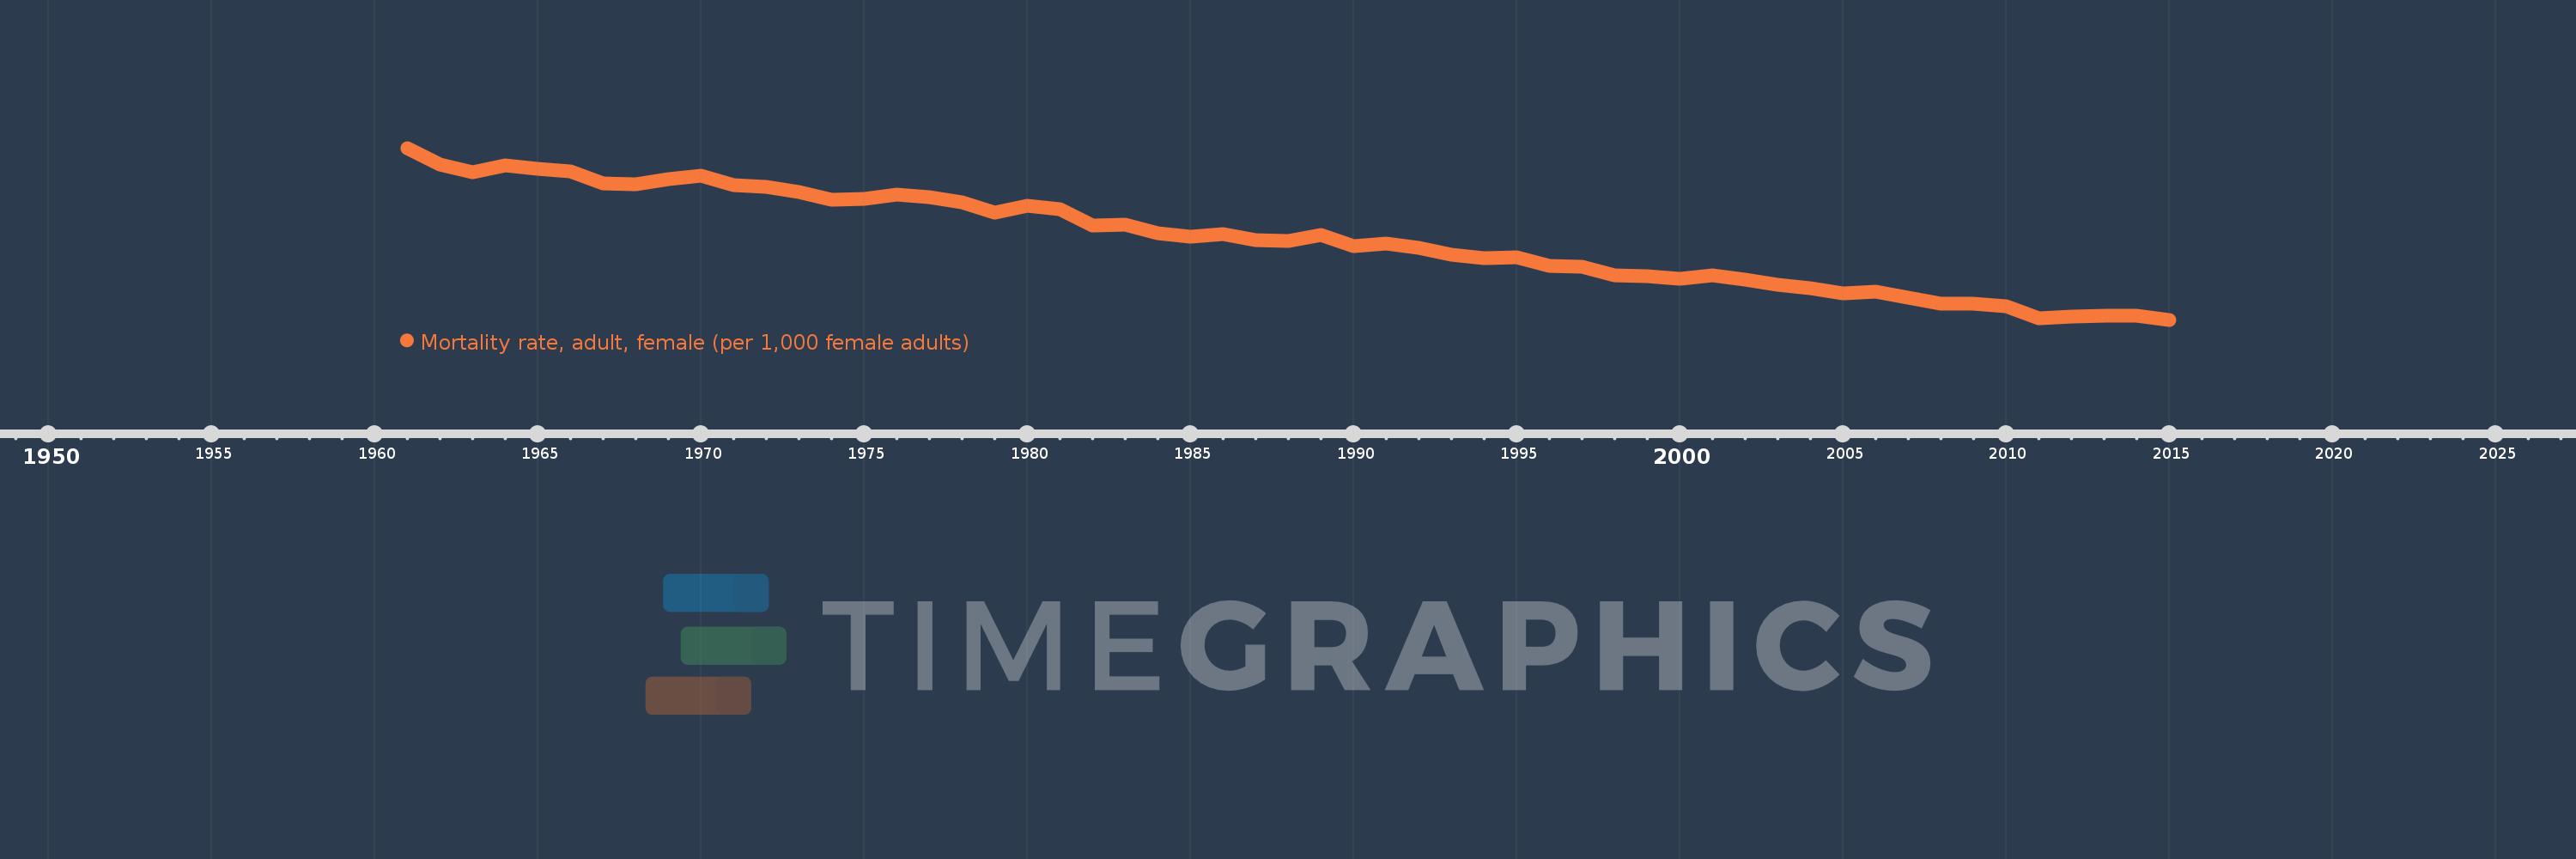
Mortality rate, adult, female (per 1,000 female adults)
2015,2014,2013,2012,2011,2010,2009,2008,2007,2006,2005,2004,2003,2002,2001,2000,1999,1998,1997,1996,1995,1994,1993,1992,1991,1990,1989,1988,1987,1986,1985,1984,1983,1982,1981,1980,1979,1978,1977,1976,1975,1974,1973,1972,1971,1970,1969,1968,1967,1966,1965,1964,1963,1962,1961
Estas estadísticas en otros países:
AfghanistanAlbaniaAlgeriaAngolaAntigua and BarbudaArab WorldArgentinaArmeniaArubaAustraliaAustriaAzerbaijanBahamas, TheBahrainBangladeshBarbadosBelarusBelgiumBelizeBeninBhutanBoliviaBosnia and HerzegovinaBotswanaBrazilBrunei DarussalamBulgariaBurkina FasoBurundiCabo VerdeCambodiaCameroonCanadaCaribbean small statesCentral African RepublicCentral Europe and the BalticsChadChannel IslandsChileChinaColombiaComorosCongo, Dem. Rep.Congo, Rep.Costa RicaCote d'IvoireCroatiaCubaCuracaoCyprusCzech RepublicDenmarkDjiboutiDominicaDominican RepublicEarly-demographic dividendEast Asia & PacificEast Asia & Pacific (excluding high income)East Asia & Pacific (IDA & IBRD countries)EcuadorEgypt, Arab Rep.El SalvadorEquatorial GuineaEritreaEstoniaEthiopiaEuro areaEurope & Central AsiaEurope & Central Asia (excluding high income)Europe & Central Asia (IDA & IBRD countries)European UnionFijiFinlandFragile and conflict affected situationsFranceFrench PolynesiaGabonGambia, TheGeorgiaGermanyGhanaGreeceGreenlandGrenadaGuamGuatemalaGuineaGuinea-BissauGuyanaHaitiHeavily indebted poor countries (HIPC)High incomeHondurasHong Kong SAR, ChinaHungaryIBRD onlyIcelandIDA & IBRD totalIDA blendIDA onlyIDA totalIndiaIndonesiaIran, Islamic Rep.IraqIrelandIsraelItalyJamaicaJapanJordanKazakhstanKenyaKiribatiKorea, Dem. People’s Rep.Korea, Rep.KuwaitKyrgyz RepublicLao PDRLate-demographic dividendLatin America & Caribbean Latin America & Caribbean (excluding high income)Latin America & the Caribbean (IDA & IBRD countries)LatviaLeast developed countries: UN classificationLebanonLesothoLiberiaLibyaLithuaniaLow & middle incomeLow incomeLower middle incomeLuxembourgMacao SAR, ChinaMacedonia, FYRMadagascarMalawiMalaysiaMaldivesMaliMaltaMarshall IslandsMauritaniaMauritiusMexicoMicronesia, Fed. Sts.Middle East & North AfricaMiddle East & North Africa (excluding high income)Middle East & North Africa (IDA & IBRD countries)Middle incomeMoldovaMongoliaMontenegroMoroccoMozambiqueMyanmarNamibiaNepalNetherlandsNew CaledoniaNew ZealandNicaraguaNigerNigeriaNorth AmericaNorwayOECD membersOmanOther small statesPacific island small statesPakistanPanamaPapua New GuineaParaguayPeruPhilippinesPolandPortugalPost-demographic dividendPre-demographic dividendPuerto RicoQatarRomaniaRussian FederationRwandaSamoaSao Tome and PrincipeSaudi ArabiaSenegalSerbiaSeychellesSierra LeoneSingaporeSlovak RepublicSloveniaSmall statesSolomon IslandsSomaliaSouth AfricaSouth AsiaSouth Asia (IDA & IBRD)South SudanSpainSri LankaSt. Kitts and NevisSt. LuciaSt. Vincent and the GrenadinesSub-Saharan Africa Sub-Saharan Africa (excluding high income)Sub-Saharan Africa (IDA & IBRD countries)SudanSurinameSwazilandSwedenSwitzerlandSyrian Arab RepublicTajikistanTanzaniaThailandTimor-LesteTogoTongaTrinidad and TobagoTunisiaTurkeyTurkmenistanUgandaUkraineUnited Arab EmiratesUnited KingdomUnited StatesUpper middle incomeUruguayUzbekistanVanuatuVenezuela, RBVietnamVirgin Islands (U.S.)West Bank and GazaWorldYemen, Rep.ZambiaZimbabwe línea de tiempo (timeline):
En esta escala de tiempo se presenta un gráfico de 1961 y 2015 de Sweden. Los datos de 1960 están ausentes. El número de observaciones reales por fecha: 55.
Fuente (nombre):
Indicadores del desarrollo mundial
Fuente (organización):
(1) United Nations Population Division. World Population Prospects. New York, United Nations, Department of Economic and Social Affairs (advanced Excel tables). Available at http://esa.un.org/wpp/unpp/panel_population.htm, (2) University of California, Berkeley, and Max Planck Institute for Demographic Research. Human Mortality Database. [ www.mortality.org or www.humanmortality.de].
Categorías:
Health, Gender
Se ha actualizado:
23 abr 2017 año
Los indicadores de los cambios de valor en los últimos años
Mínimo:
42.586
1 ene 2015 año
Máximo:
95.043
1 ene 1961 año
A la fecha de observación
Valor
Cambio absoluto
El cambio con respecto al valor anterior
1 ene 1961 año
95.043
+95.043
0.0%
1 ene 1962 año
89.877
-5.166
-5.44%
1 ene 1963 año
87.736
-2.141
-2.38%
1 ene 1964 año
89.829
+2.093
2.39%
1 ene 1965 año
88.768
-1.061
-1.18%
1 ene 1966 año
87.787
-0.981
-1.11%
1 ene 1967 año
84.132
-3.655
-4.16%
1 ene 1968 año
83.949
-0.183
-0.22%
1 ene 1969 año
85.598
+1.649
1.96%
1 ene 1970 año
86.506
+0.908
1.06%
1 ene 1971 año
83.8
-2.706
-3.13%
1 ene 1972 año
83.049
-0.751
-0.9%
1 ene 1973 año
81.485
-1.564
-1.88%
1 ene 1974 año
79.334
-2.151
-2.64%
1 ene 1975 año
79.511
+0.177
0.22%
1 ene 1976 año
80.878
+1.367
1.72%
1 ene 1977 año
79.912
-0.966
-1.19%
1 ene 1978 año
78.34
-1.572
-1.97%
1 ene 1979 año
75.259
-3.081
-3.93%
1 ene 1980 año
77.424
+2.165
2.88%
1 ene 1981 año
76.335
-1.089
-1.41%
1 ene 1982 año
71.271
-5.064
-6.63%
1 ene 1983 año
71.656
+0.385
0.54%
1 ene 1984 año
69.092
-2.564
-3.58%
1 ene 1985 año
67.894
-1.198
-1.73%
1 ene 1986 año
68.676
+0.782
1.15%
1 ene 1987 año
66.887
-1.789
-2.6%
1 ene 1988 año
66.608
-0.279
-0.42%
1 ene 1989 año
68.555
+1.947
2.92%
1 ene 1990 año
65.042
-3.513
-5.12%
1 ene 1991 año
65.737
+0.695
1.07%
1 ene 1992 año
64.635
-1.102
-1.68%
1 ene 1993 año
62.527
-2.108
-3.26%
1 ene 1994 año
61.344
-1.183
-1.89%
1 ene 1995 año
61.592
+0.248
0.4%
1 ene 1996 año
58.91
-2.682
-4.35%
1 ene 1997 año
58.806
-0.104
-0.18%
1 ene 1998 año
56.234
-2.572
-4.37%
1 ene 1999 año
55.923
-0.311
-0.55%
1 ene 2000 año
55.215
-0.708
-1.27%
1 ene 2001 año
56.197
+0.982
1.78%
1 ene 2002 año
54.839
-1.358
-2.42%
1 ene 2003 año
53.376
-1.463
-2.67%
1 ene 2004 año
52.138
-1.238
-2.32%
1 ene 2005 año
50.588
-1.55
-2.97%
1 ene 2006 año
51.086
+0.498
0.98%
1 ene 2007 año
49.425
-1.661
-3.25%
1 ene 2008 año
47.542
-1.883
-3.81%
1 ene 2009 año
47.379
-0.163
-0.34%
1 ene 2010 año
46.718
-0.661
-1.4%
1 ene 2011 año
43.111
-3.607
-7.72%
1 ene 2012 año
43.572
+0.461
1.07%
1 ene 2013 año
43.723
+0.151
0.35%
1 ene 2014 año
43.723
0.0
0.0%
1 ene 2015 año
42.586
-1.137
-2.6%
Ranking de los países por los datos estadísticos actuales


Comentarios: