29
/es/
es
AIzaSyAYiBZKx7MnpbEhh9jyipgxe19OcubqV5w
April 1, 2024
118182
Czech Republic
CZE
true
2
1
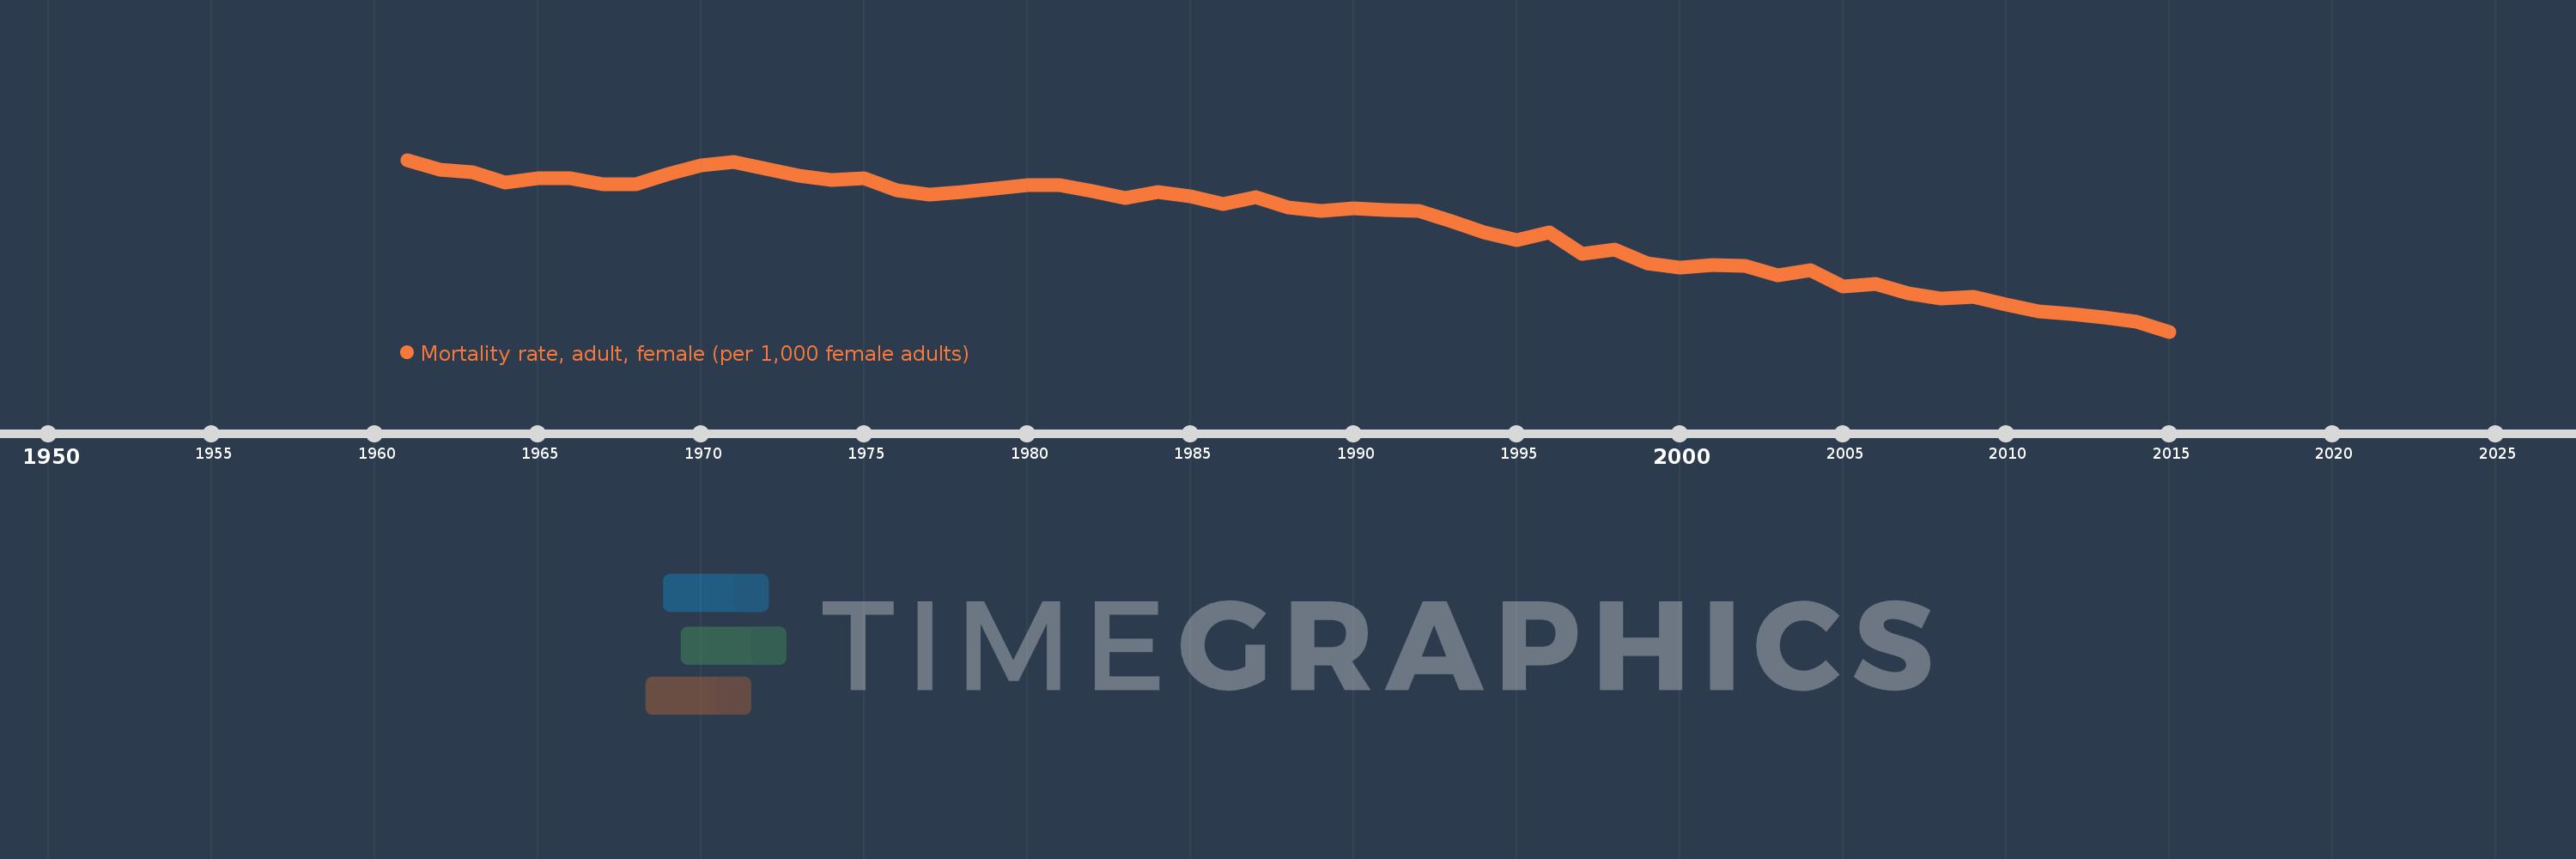
Mortality rate, adult, female (per 1,000 female adults)
2015,2014,2013,2012,2011,2010,2009,2008,2007,2006,2005,2004,2003,2002,2001,2000,1999,1998,1997,1996,1995,1994,1993,1992,1991,1990,1989,1988,1987,1986,1985,1984,1983,1982,1981,1980,1979,1978,1977,1976,1975,1974,1973,1972,1971,1970,1969,1968,1967,1966,1965,1964,1963,1962,1961
Estas estadísticas en otros países:
AfghanistanAlbaniaAlgeriaAngolaAntigua and BarbudaArab WorldArgentinaArmeniaArubaAustraliaAustriaAzerbaijanBahamas, TheBahrainBangladeshBarbadosBelarusBelgiumBelizeBeninBhutanBoliviaBosnia and HerzegovinaBotswanaBrazilBrunei DarussalamBulgariaBurkina FasoBurundiCabo VerdeCambodiaCameroonCanadaCaribbean small statesCentral African RepublicCentral Europe and the BalticsChadChannel IslandsChileChinaColombiaComorosCongo, Dem. Rep.Congo, Rep.Costa RicaCote d'IvoireCroatiaCubaCuracaoCyprusCzech RepublicDenmarkDjiboutiDominicaDominican RepublicEarly-demographic dividendEast Asia & PacificEast Asia & Pacific (excluding high income)East Asia & Pacific (IDA & IBRD countries)EcuadorEgypt, Arab Rep.El SalvadorEquatorial GuineaEritreaEstoniaEthiopiaEuro areaEurope & Central AsiaEurope & Central Asia (excluding high income)Europe & Central Asia (IDA & IBRD countries)European UnionFijiFinlandFragile and conflict affected situationsFranceFrench PolynesiaGabonGambia, TheGeorgiaGermanyGhanaGreeceGreenlandGrenadaGuamGuatemalaGuineaGuinea-BissauGuyanaHaitiHeavily indebted poor countries (HIPC)High incomeHondurasHong Kong SAR, ChinaHungaryIBRD onlyIcelandIDA & IBRD totalIDA blendIDA onlyIDA totalIndiaIndonesiaIran, Islamic Rep.IraqIrelandIsraelItalyJamaicaJapanJordanKazakhstanKenyaKiribatiKorea, Dem. People’s Rep.Korea, Rep.KuwaitKyrgyz RepublicLao PDRLate-demographic dividendLatin America & Caribbean Latin America & Caribbean (excluding high income)Latin America & the Caribbean (IDA & IBRD countries)LatviaLeast developed countries: UN classificationLebanonLesothoLiberiaLibyaLithuaniaLow & middle incomeLow incomeLower middle incomeLuxembourgMacao SAR, ChinaMacedonia, FYRMadagascarMalawiMalaysiaMaldivesMaliMaltaMarshall IslandsMauritaniaMauritiusMexicoMicronesia, Fed. Sts.Middle East & North AfricaMiddle East & North Africa (excluding high income)Middle East & North Africa (IDA & IBRD countries)Middle incomeMoldovaMongoliaMontenegroMoroccoMozambiqueMyanmarNamibiaNepalNetherlandsNew CaledoniaNew ZealandNicaraguaNigerNigeriaNorth AmericaNorwayOECD membersOmanOther small statesPacific island small statesPakistanPanamaPapua New GuineaParaguayPeruPhilippinesPolandPortugalPost-demographic dividendPre-demographic dividendPuerto RicoQatarRomaniaRussian FederationRwandaSamoaSao Tome and PrincipeSaudi ArabiaSenegalSerbiaSeychellesSierra LeoneSingaporeSlovak RepublicSloveniaSmall statesSolomon IslandsSomaliaSouth AfricaSouth AsiaSouth Asia (IDA & IBRD)South SudanSpainSri LankaSt. Kitts and NevisSt. LuciaSt. Vincent and the GrenadinesSub-Saharan Africa Sub-Saharan Africa (excluding high income)Sub-Saharan Africa (IDA & IBRD countries)SudanSurinameSwazilandSwedenSwitzerlandSyrian Arab RepublicTajikistanTanzaniaThailandTimor-LesteTogoTongaTrinidad and TobagoTunisiaTurkeyTurkmenistanUgandaUkraineUnited Arab EmiratesUnited KingdomUnited StatesUpper middle incomeUruguayUzbekistanVanuatuVenezuela, RBVietnamVirgin Islands (U.S.)West Bank and GazaWorldYemen, Rep.ZambiaZimbabwe línea de tiempo (timeline):
En esta escala de tiempo se presenta un gráfico de 1961 y 2015 de Czech Republic. Los datos de 1960 están ausentes. El número de observaciones reales por fecha: 55.
Fuente (nombre):
Indicadores del desarrollo mundial
Fuente (organización):
(1) United Nations Population Division. World Population Prospects. New York, United Nations, Department of Economic and Social Affairs (advanced Excel tables). Available at http://esa.un.org/wpp/unpp/panel_population.htm, (2) University of California, Berkeley, and Max Planck Institute for Demographic Research. Human Mortality Database. [ www.mortality.org or www.humanmortality.de].
Categorías:
Health, Gender
Se ha actualizado:
23 abr 2017 año
Los indicadores de los cambios de valor en los últimos años
Mínimo:
53.392
1 ene 2015 año
Máximo:
112.213
1 ene 1961 año
A la fecha de observación
Valor
Cambio absoluto
El cambio con respecto al valor anterior
1 ene 1961 año
112.213
+112.213
0.0%
1 ene 1962 año
108.802
-3.411
-3.04%
1 ene 1963 año
107.869
-0.933
-0.86%
1 ene 1964 año
104.523
-3.346
-3.1%
1 ene 1965 año
105.743
+1.22
1.17%
1 ene 1966 año
105.81
+0.067
0.06%
1 ene 1967 año
103.84
-1.97
-1.86%
1 ene 1968 año
103.831
-0.009
-0.01%
1 ene 1969 año
107.224
+3.393
3.27%
1 ene 1970 año
110.157
+2.933
2.74%
1 ene 1971 año
111.564
+1.407
1.28%
1 ene 1972 año
109.129
-2.435
-2.18%
1 ene 1973 año
106.659
-2.47
-2.26%
1 ene 1974 año
105.336
-1.323
-1.24%
1 ene 1975 año
105.824
+0.488
0.46%
1 ene 1976 año
101.871
-3.953
-3.74%
1 ene 1977 año
100.293
-1.578
-1.55%
1 ene 1978 año
101.267
+0.974
0.97%
1 ene 1979 año
102.421
+1.154
1.14%
1 ene 1980 año
103.618
+1.197
1.17%
1 ene 1981 año
103.501
-0.117
-0.11%
1 ene 1982 año
101.39
-2.111
-2.04%
1 ene 1983 año
99.241
-2.149
-2.12%
1 ene 1984 año
101.172
+1.931
1.95%
1 ene 1985 año
99.664
-1.508
-1.49%
1 ene 1986 año
97.087
-2.577
-2.59%
1 ene 1987 año
99.281
+2.194
2.26%
1 ene 1988 año
95.853
-3.428
-3.45%
1 ene 1989 año
94.8
-1.053
-1.1%
1 ene 1990 año
95.522
+0.722
0.76%
1 ene 1991 año
95.007
-0.515
-0.54%
1 ene 1992 año
94.748
-0.259
-0.27%
1 ene 1993 año
91.171
-3.577
-3.78%
1 ene 1994 año
87.493
-3.678
-4.03%
1 ene 1995 año
84.578
-2.915
-3.33%
1 ene 1996 año
87.479
+2.901
3.43%
1 ene 1997 año
80.032
-7.447
-8.51%
1 ene 1998 año
81.502
+1.47
1.84%
1 ene 1999 año
76.819
-4.683
-5.75%
1 ene 2000 año
75.274
-1.545
-2.01%
1 ene 2001 año
76.188
+0.914
1.21%
1 ene 2002 año
75.774
-0.414
-0.54%
1 ene 2003 año
72.61
-3.164
-4.18%
1 ene 2004 año
74.299
+1.689
2.33%
1 ene 2005 año
68.786
-5.513
-7.42%
1 ene 2006 año
69.68
+0.894
1.3%
1 ene 2007 año
66.391
-3.289
-4.72%
1 ene 2008 año
64.748
-1.643
-2.47%
1 ene 2009 año
65.293
+0.545
0.84%
1 ene 2010 año
62.793
-2.5
-3.83%
1 ene 2011 año
60.311
-2.482
-3.95%
1 ene 2012 año
59.491
-0.82
-1.36%
1 ene 2013 año
58.306
-1.185
-1.99%
1 ene 2014 año
56.71
-1.596
-2.74%
1 ene 2015 año
53.392
-3.318
-5.85%
Ranking de los países por los datos estadísticos actuales


Comentarios: