29
/es/
es
AIzaSyAYiBZKx7MnpbEhh9jyipgxe19OcubqV5w
April 1, 2024
130772
Ethiopia
ETH
true
2
1
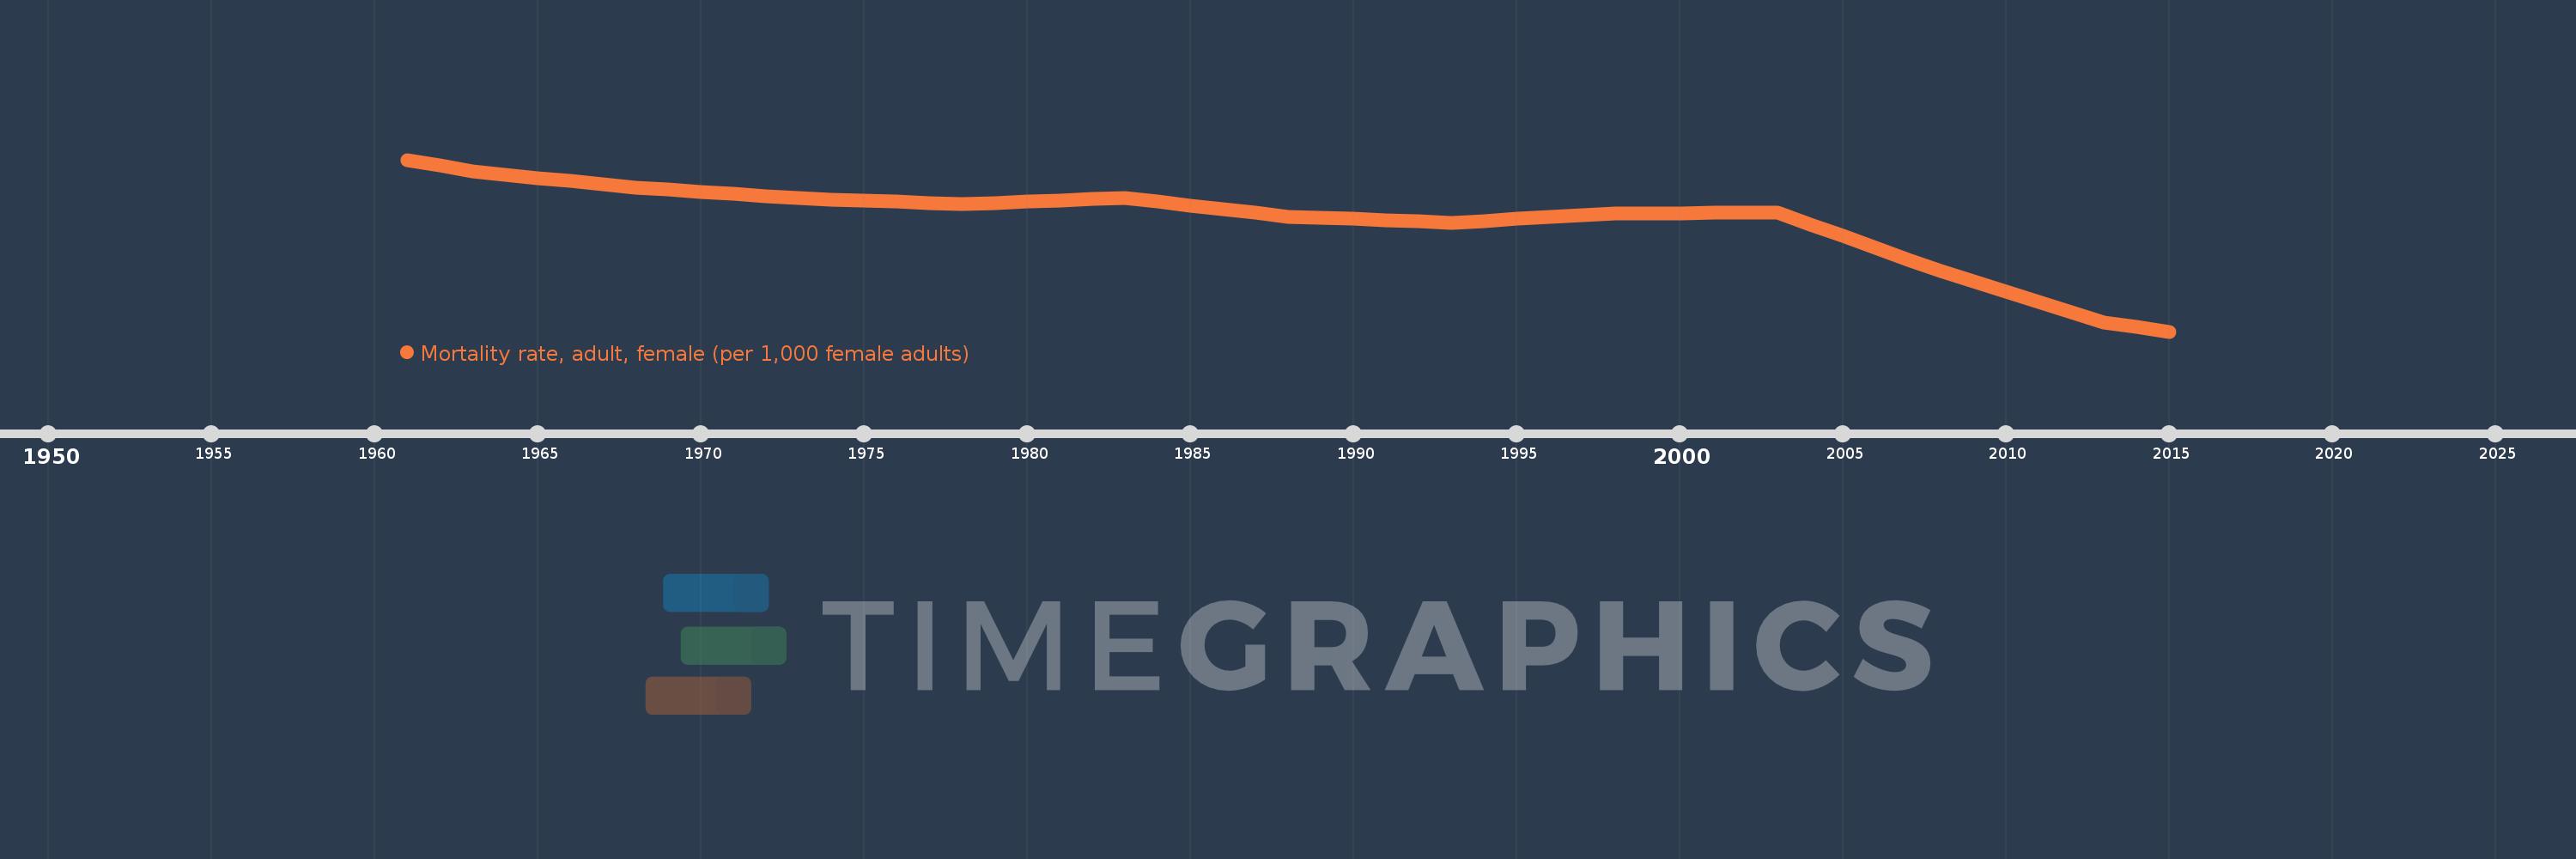
Mortality rate, adult, female (per 1,000 female adults)
2015,2014,2013,2012,2011,2010,2009,2008,2007,2006,2005,2004,2003,2002,2001,2000,1999,1998,1997,1996,1995,1994,1993,1992,1991,1990,1989,1988,1987,1986,1985,1984,1983,1982,1981,1980,1979,1978,1977,1976,1975,1974,1973,1972,1971,1970,1969,1968,1967,1966,1965,1964,1963,1962,1961
Estas estadísticas en otros países:
AfghanistanAlbaniaAlgeriaAngolaAntigua and BarbudaArab WorldArgentinaArmeniaArubaAustraliaAustriaAzerbaijanBahamas, TheBahrainBangladeshBarbadosBelarusBelgiumBelizeBeninBhutanBoliviaBosnia and HerzegovinaBotswanaBrazilBrunei DarussalamBulgariaBurkina FasoBurundiCabo VerdeCambodiaCameroonCanadaCaribbean small statesCentral African RepublicCentral Europe and the BalticsChadChannel IslandsChileChinaColombiaComorosCongo, Dem. Rep.Congo, Rep.Costa RicaCote d'IvoireCroatiaCubaCuracaoCyprusCzech RepublicDenmarkDjiboutiDominicaDominican RepublicEarly-demographic dividendEast Asia & PacificEast Asia & Pacific (excluding high income)East Asia & Pacific (IDA & IBRD countries)EcuadorEgypt, Arab Rep.El SalvadorEquatorial GuineaEritreaEstoniaEthiopiaEuro areaEurope & Central AsiaEurope & Central Asia (excluding high income)Europe & Central Asia (IDA & IBRD countries)European UnionFijiFinlandFragile and conflict affected situationsFranceFrench PolynesiaGabonGambia, TheGeorgiaGermanyGhanaGreeceGreenlandGrenadaGuamGuatemalaGuineaGuinea-BissauGuyanaHaitiHeavily indebted poor countries (HIPC)High incomeHondurasHong Kong SAR, ChinaHungaryIBRD onlyIcelandIDA & IBRD totalIDA blendIDA onlyIDA totalIndiaIndonesiaIran, Islamic Rep.IraqIrelandIsraelItalyJamaicaJapanJordanKazakhstanKenyaKiribatiKorea, Dem. People’s Rep.Korea, Rep.KuwaitKyrgyz RepublicLao PDRLate-demographic dividendLatin America & Caribbean Latin America & Caribbean (excluding high income)Latin America & the Caribbean (IDA & IBRD countries)LatviaLeast developed countries: UN classificationLebanonLesothoLiberiaLibyaLithuaniaLow & middle incomeLow incomeLower middle incomeLuxembourgMacao SAR, ChinaMacedonia, FYRMadagascarMalawiMalaysiaMaldivesMaliMaltaMarshall IslandsMauritaniaMauritiusMexicoMicronesia, Fed. Sts.Middle East & North AfricaMiddle East & North Africa (excluding high income)Middle East & North Africa (IDA & IBRD countries)Middle incomeMoldovaMongoliaMontenegroMoroccoMozambiqueMyanmarNamibiaNepalNetherlandsNew CaledoniaNew ZealandNicaraguaNigerNigeriaNorth AmericaNorwayOECD membersOmanOther small statesPacific island small statesPakistanPanamaPapua New GuineaParaguayPeruPhilippinesPolandPortugalPost-demographic dividendPre-demographic dividendPuerto RicoQatarRomaniaRussian FederationRwandaSamoaSao Tome and PrincipeSaudi ArabiaSenegalSerbiaSeychellesSierra LeoneSingaporeSlovak RepublicSloveniaSmall statesSolomon IslandsSomaliaSouth AfricaSouth AsiaSouth Asia (IDA & IBRD)South SudanSpainSri LankaSt. Kitts and NevisSt. LuciaSt. Vincent and the GrenadinesSub-Saharan Africa Sub-Saharan Africa (excluding high income)Sub-Saharan Africa (IDA & IBRD countries)SudanSurinameSwazilandSwedenSwitzerlandSyrian Arab RepublicTajikistanTanzaniaThailandTimor-LesteTogoTongaTrinidad and TobagoTunisiaTurkeyTurkmenistanUgandaUkraineUnited Arab EmiratesUnited KingdomUnited StatesUpper middle incomeUruguayUzbekistanVanuatuVenezuela, RBVietnamVirgin Islands (U.S.)West Bank and GazaWorldYemen, Rep.ZambiaZimbabwe línea de tiempo (timeline):
En esta escala de tiempo se presenta un gráfico de 1961 y 2015 de Ethiopia. Los datos de 1960 están ausentes. El número de observaciones reales por fecha: 55.
Fuente (nombre):
Indicadores del desarrollo mundial
Fuente (organización):
(1) United Nations Population Division. World Population Prospects. New York, United Nations, Department of Economic and Social Affairs (advanced Excel tables). Available at http://esa.un.org/wpp/unpp/panel_population.htm, (2) University of California, Berkeley, and Max Planck Institute for Demographic Research. Human Mortality Database. [ www.mortality.org or www.humanmortality.de].
Categorías:
Health, Gender
Se ha actualizado:
23 abr 2017 año
Los indicadores de los cambios de valor en los últimos años
Mínimo:
202.954
1 ene 2015 año
Máximo:
438.492
1 ene 1961 año
A la fecha de observación
Valor
Cambio absoluto
El cambio con respecto al valor anterior
1 ene 1961 año
438.492
+438.492
0.0%
1 ene 1962 año
430.608
-7.884
-1.8%
1 ene 1963 año
422.723
-7.885
-1.83%
1 ene 1964 año
418.241
-4.482
-1.06%
1 ene 1965 año
413.758
-4.483
-1.07%
1 ene 1966 año
409.276
-4.482
-1.08%
1 ene 1967 año
404.793
-4.483
-1.1%
1 ene 1968 año
400.311
-4.482
-1.11%
1 ene 1969 año
397.391
-2.92
-0.73%
1 ene 1970 año
394.471
-2.92
-0.73%
1 ene 1971 año
391.55
-2.921
-0.74%
1 ene 1972 año
388.63
-2.92
-0.75%
1 ene 1973 año
385.71
-2.92
-0.75%
1 ene 1974 año
384.148
-1.562
-0.4%
1 ene 1975 año
382.585
-1.563
-0.41%
1 ene 1976 año
381.023
-1.562
-0.41%
1 ene 1977 año
379.46
-1.563
-0.41%
1 ene 1978 año
377.898
-1.562
-0.41%
1 ene 1979 año
379.607
+1.709
0.45%
1 ene 1980 año
381.317
+1.71
0.45%
1 ene 1981 año
383.027
+1.71
0.45%
1 ene 1982 año
384.736
+1.709
0.45%
1 ene 1983 año
386.446
+1.71
0.44%
1 ene 1984 año
381.237
-5.209
-1.35%
1 ene 1985 año
376.028
-5.209
-1.37%
1 ene 1986 año
370.819
-5.209
-1.39%
1 ene 1987 año
365.61
-5.209
-1.4%
1 ene 1988 año
360.401
-5.209
-1.42%
1 ene 1989 año
358.818
-1.583
-0.44%
1 ene 1990 año
357.234
-1.584
-0.44%
1 ene 1991 año
355.651
-1.583
-0.44%
1 ene 1992 año
354.068
-1.583
-0.45%
1 ene 1993 año
352.484
-1.584
-0.45%
1 ene 1994 año
354.871
+2.387
0.68%
1 ene 1995 año
357.258
+2.387
0.67%
1 ene 1996 año
359.644
+2.386
0.67%
1 ene 1997 año
362.031
+2.387
0.66%
1 ene 1998 año
364.417
+2.386
0.66%
1 ene 1999 año
364.79
+0.373
0.1%
1 ene 2000 año
365.164
+0.374
0.1%
1 ene 2001 año
365.537
+0.373
0.1%
1 ene 2002 año
365.911
+0.374
0.1%
1 ene 2003 año
366.284
+0.373
0.1%
1 ene 2004 año
350.161
-16.123
-4.4%
1 ene 2005 año
334.037
-16.124
-4.6%
1 ene 2006 año
317.914
-16.123
-4.83%
1 ene 2007 año
301.791
-16.123
-5.07%
1 ene 2008 año
285.668
-16.123
-5.34%
1 ene 2009 año
271.706
-13.962
-4.89%
1 ene 2010 año
257.745
-13.961
-5.14%
1 ene 2011 año
243.784
-13.961
-5.42%
1 ene 2012 año
229.822
-13.962
-5.73%
1 ene 2013 año
215.861
-13.961
-6.07%
1 ene 2014 año
209.408
-6.453
-2.99%
1 ene 2015 año
202.954
-6.454
-3.08%
Ranking de los países por los datos estadísticos actuales


Comentarios: