29
/es/
es
AIzaSyAYiBZKx7MnpbEhh9jyipgxe19OcubqV5w
April 1, 2024
29008
East Asia & Pacific (IDA & IBRD countries)
TEA
false
2
1
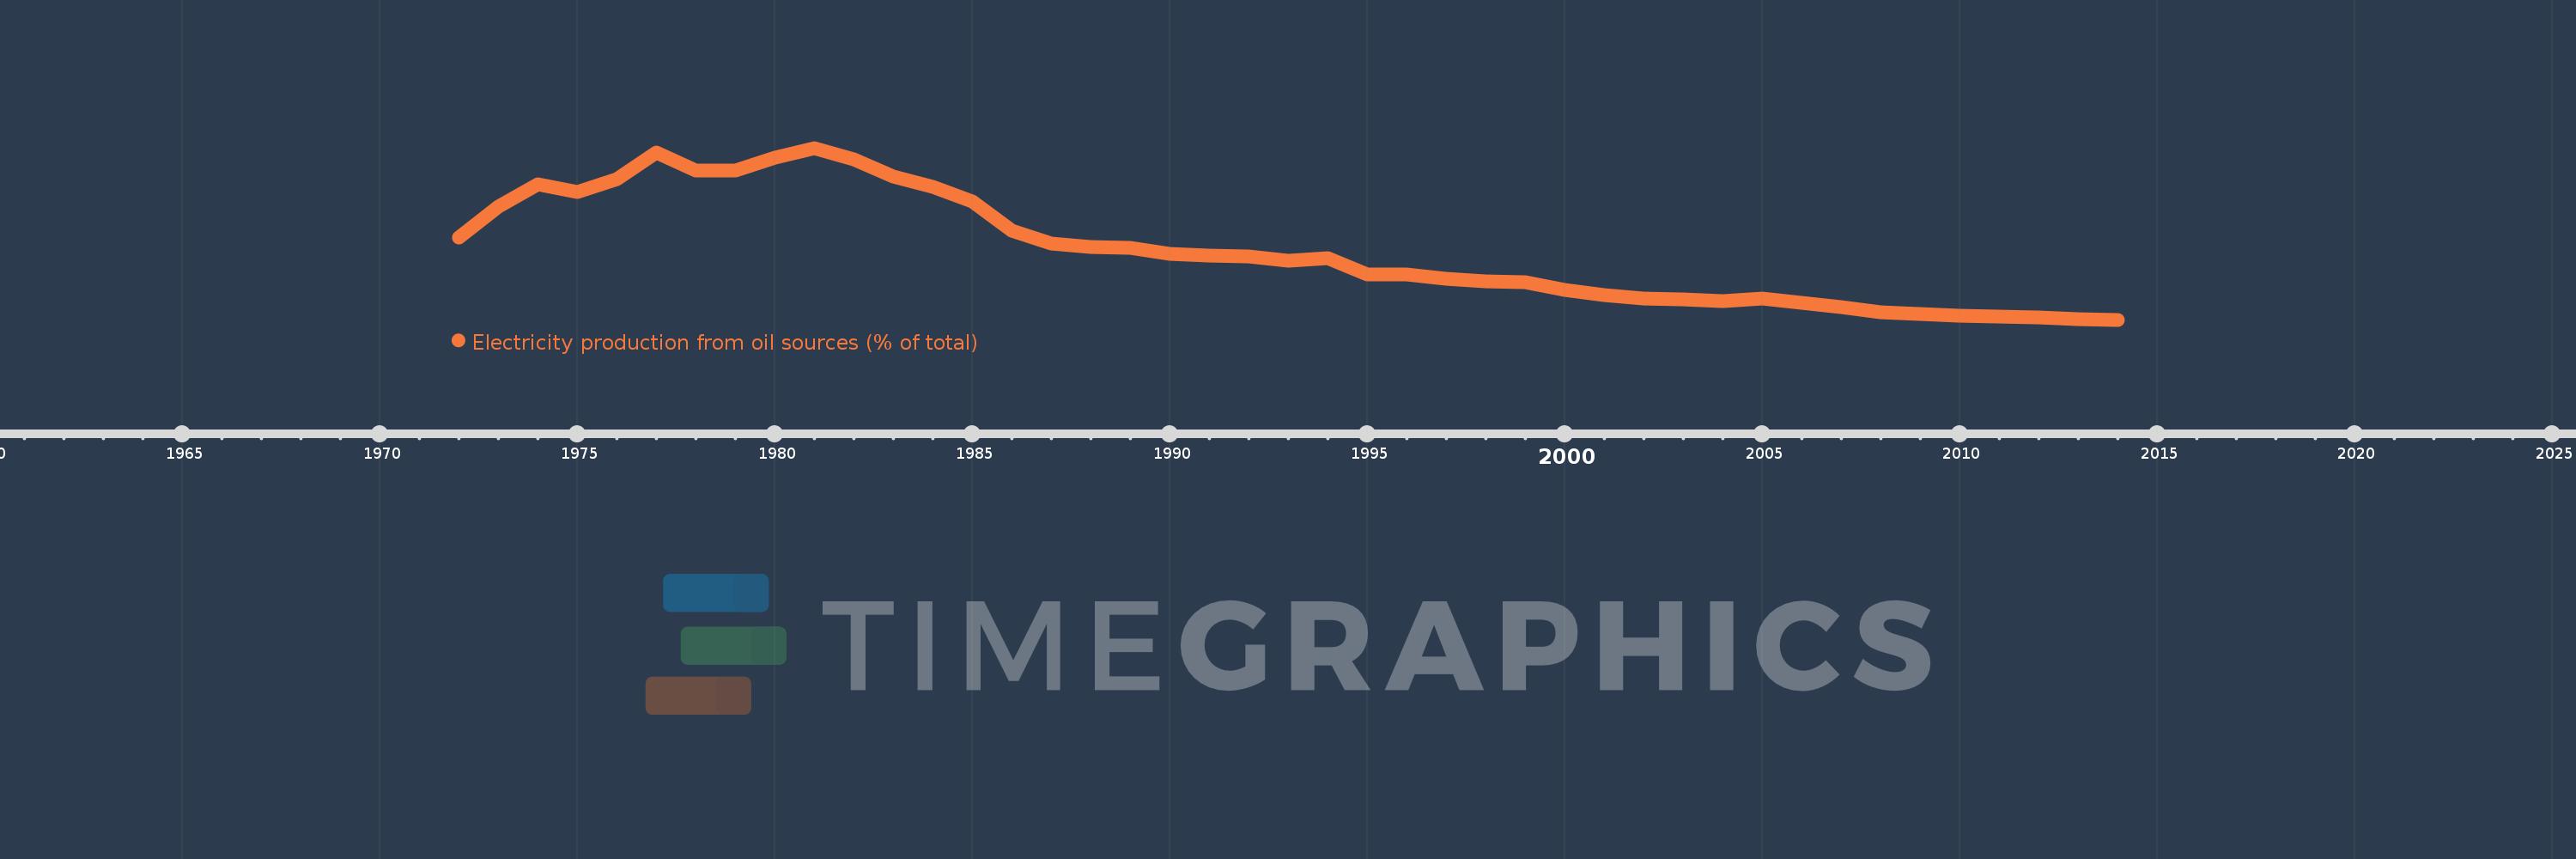
Electricity production from oil sources (% of total)
2014,2013,2012,2011,2010,2009,2008,2007,2006,2005,2004,2003,2002,2001,2000,1999,1998,1997,1996,1995,1994,1993,1992,1991,1990,1989,1988,1987,1986,1985,1984,1983,1982,1981,1980,1979,1978,1977,1976,1975,1974,1973,1972
Estas estadísticas en otros países:
AlbaniaAlgeriaAngolaArab WorldArgentinaArmeniaAustraliaAustriaAzerbaijanBahrainBangladeshBelarusBelgiumBeninBoliviaBosnia and HerzegovinaBotswanaBrazilBrunei DarussalamBulgariaCambodiaCameroonCanadaCentral Europe and the BalticsChileChinaColombiaCongo, Dem. Rep.Congo, Rep.Costa RicaCote d'IvoireCroatiaCubaCuracaoCyprusCzech RepublicDenmarkDominican RepublicEarly-demographic dividendEast Asia & PacificEast Asia & Pacific (excluding high income)East Asia & Pacific (IDA & IBRD countries)EcuadorEgypt, Arab Rep.El SalvadorEritreaEstoniaEthiopiaEuro areaEurope & Central AsiaEurope & Central Asia (excluding high income)Europe & Central Asia (IDA & IBRD countries)European UnionFinlandFragile and conflict affected situationsFranceGabonGeorgiaGermanyGhanaGibraltarGreeceGuatemalaHaitiHeavily indebted poor countries (HIPC)High incomeHondurasHong Kong SAR, ChinaHungaryIBRD onlyIcelandIDA & IBRD totalIDA blendIDA onlyIDA totalIndiaIndonesiaIran, Islamic Rep.IraqIrelandIsraelItalyJamaicaJapanJordanKazakhstanKenyaKorea, Dem. People’s Rep.Korea, Rep.KosovoKuwaitKyrgyz RepublicLate-demographic dividendLatin America & Caribbean Latin America & Caribbean (excluding high income)Latin America & the Caribbean (IDA & IBRD countries)LatviaLeast developed countries: UN classificationLebanonLibyaLithuaniaLow & middle incomeLower middle incomeLuxembourgMacedonia, FYRMalaysiaMaltaMauritiusMexicoMiddle East & North AfricaMiddle East & North Africa (excluding high income)Middle East & North Africa (IDA & IBRD countries)Middle incomeMoldovaMongoliaMontenegroMoroccoMozambiqueMyanmarNamibiaNepalNetherlandsNew ZealandNicaraguaNigerNigeriaNorth AmericaNorwayOECD membersOmanOther small statesPakistanPanamaParaguayPeruPhilippinesPolandPortugalPost-demographic dividendPre-demographic dividendQatarRomaniaRussian FederationSaudi ArabiaSenegalSerbiaSingaporeSlovak RepublicSloveniaSmall statesSouth AfricaSouth AsiaSouth Asia (IDA & IBRD)South SudanSpainSri LankaSub-Saharan Africa Sub-Saharan Africa (excluding high income)Sub-Saharan Africa (IDA & IBRD countries)SudanSwedenSwitzerlandSyrian Arab RepublicTajikistanTanzaniaThailandTogoTrinidad and TobagoTunisiaTurkeyTurkmenistanUkraineUnited Arab EmiratesUnited KingdomUnited StatesUpper middle incomeUruguayUzbekistanVenezuela, RBVietnamWorldYemen, Rep.ZambiaZimbabwe línea de tiempo (timeline):
En esta escala de tiempo se presenta un gráfico de 1972 y 2014 de East Asia & Pacific (IDA & IBRD countries). Los datos de 1971 están ausentes. El número de observaciones reales por fecha: 43.
Fuente (nombre):
Indicadores del desarrollo mundial
Fuente (organización):
IEA Statistics © OECD/IEA 2014 (http://www.iea.org/stats/index.asp), subject to https://www.iea.org/t&c/termsandconditions/
Categorías:
Energy & Mining, Climate Change, Infrastructure
Se ha actualizado:
23 abr 2017 año
Los indicadores de los cambios de valor en los últimos años
Mínimo:
0.777
1 ene 2014 año
Máximo:
34.004
1 ene 1981 año
A la fecha de observación
Valor
Cambio absoluto
El cambio con respecto al valor anterior
1 ene 1972 año
16.714
+16.714
0.0%
1 ene 1973 año
22.609
+5.894
35.27%
1 ene 1974 año
27.013
+4.405
19.48%
1 ene 1975 año
25.538
-1.476
-5.46%
1 ene 1976 año
27.932
+2.395
9.38%
1 ene 1977 año
33.064
+5.132
18.37%
1 ene 1978 año
29.572
-3.492
-10.56%
1 ene 1979 año
29.589
+0.017
0.06%
1 ene 1980 año
32.078
+2.489
8.41%
1 ene 1981 año
34.004
+1.926
6.0%
1 ene 1982 año
31.853
-2.15
-6.32%
1 ene 1983 año
28.437
-3.417
-10.73%
1 ene 1984 año
26.539
-1.898
-6.67%
1 ene 1985 año
23.615
-2.924
-11.02%
1 ene 1986 año
17.939
-5.676
-24.04%
1 ene 1987 año
15.475
-2.464
-13.74%
1 ene 1988 año
14.864
-0.611
-3.95%
1 ene 1989 año
14.631
-0.233
-1.57%
1 ene 1990 año
13.451
-1.18
-8.07%
1 ene 1991 año
13.197
-0.253
-1.88%
1 ene 1992 año
12.939
-0.258
-1.96%
1 ene 1993 año
12.211
-0.728
-5.63%
1 ene 1994 año
12.687
+0.476
3.9%
1 ene 1995 año
9.519
-3.167
-24.97%
1 ene 1996 año
9.51
-0.009
-0.1%
1 ene 1997 año
8.665
-0.845
-8.88%
1 ene 1998 año
8.189
-0.477
-5.5%
1 ene 1999 año
8.078
-0.111
-1.35%
1 ene 2000 año
6.589
-1.489
-18.43%
1 ene 2001 año
5.537
-1.053
-15.98%
1 ene 2002 año
4.935
-0.602
-10.87%
1 ene 2003 año
4.784
-0.151
-3.05%
1 ene 2004 año
4.459
-0.326
-6.8%
1 ene 2005 año
4.959
+0.501
11.23%
1 ene 2006 año
4.112
-0.848
-17.1%
1 ene 2007 año
3.29
-0.822
-19.98%
1 ene 2008 año
2.305
-0.985
-29.94%
1 ene 2009 año
1.935
-0.371
-16.08%
1 ene 2010 año
1.493
-0.442
-22.84%
1 ene 2011 año
1.319
-0.174
-11.64%
1 ene 2012 año
1.284
-0.035
-2.65%
1 ene 2013 año
0.926
-0.358
-27.86%
1 ene 2014 año
0.777
-0.149
-16.14%
Ranking de los países por los datos estadísticos actuales


Comentarios: