29
/es/
es
AIzaSyAYiBZKx7MnpbEhh9jyipgxe19OcubqV5w
April 1, 2024
27204
East Asia & Pacific
EAS
false
2
1
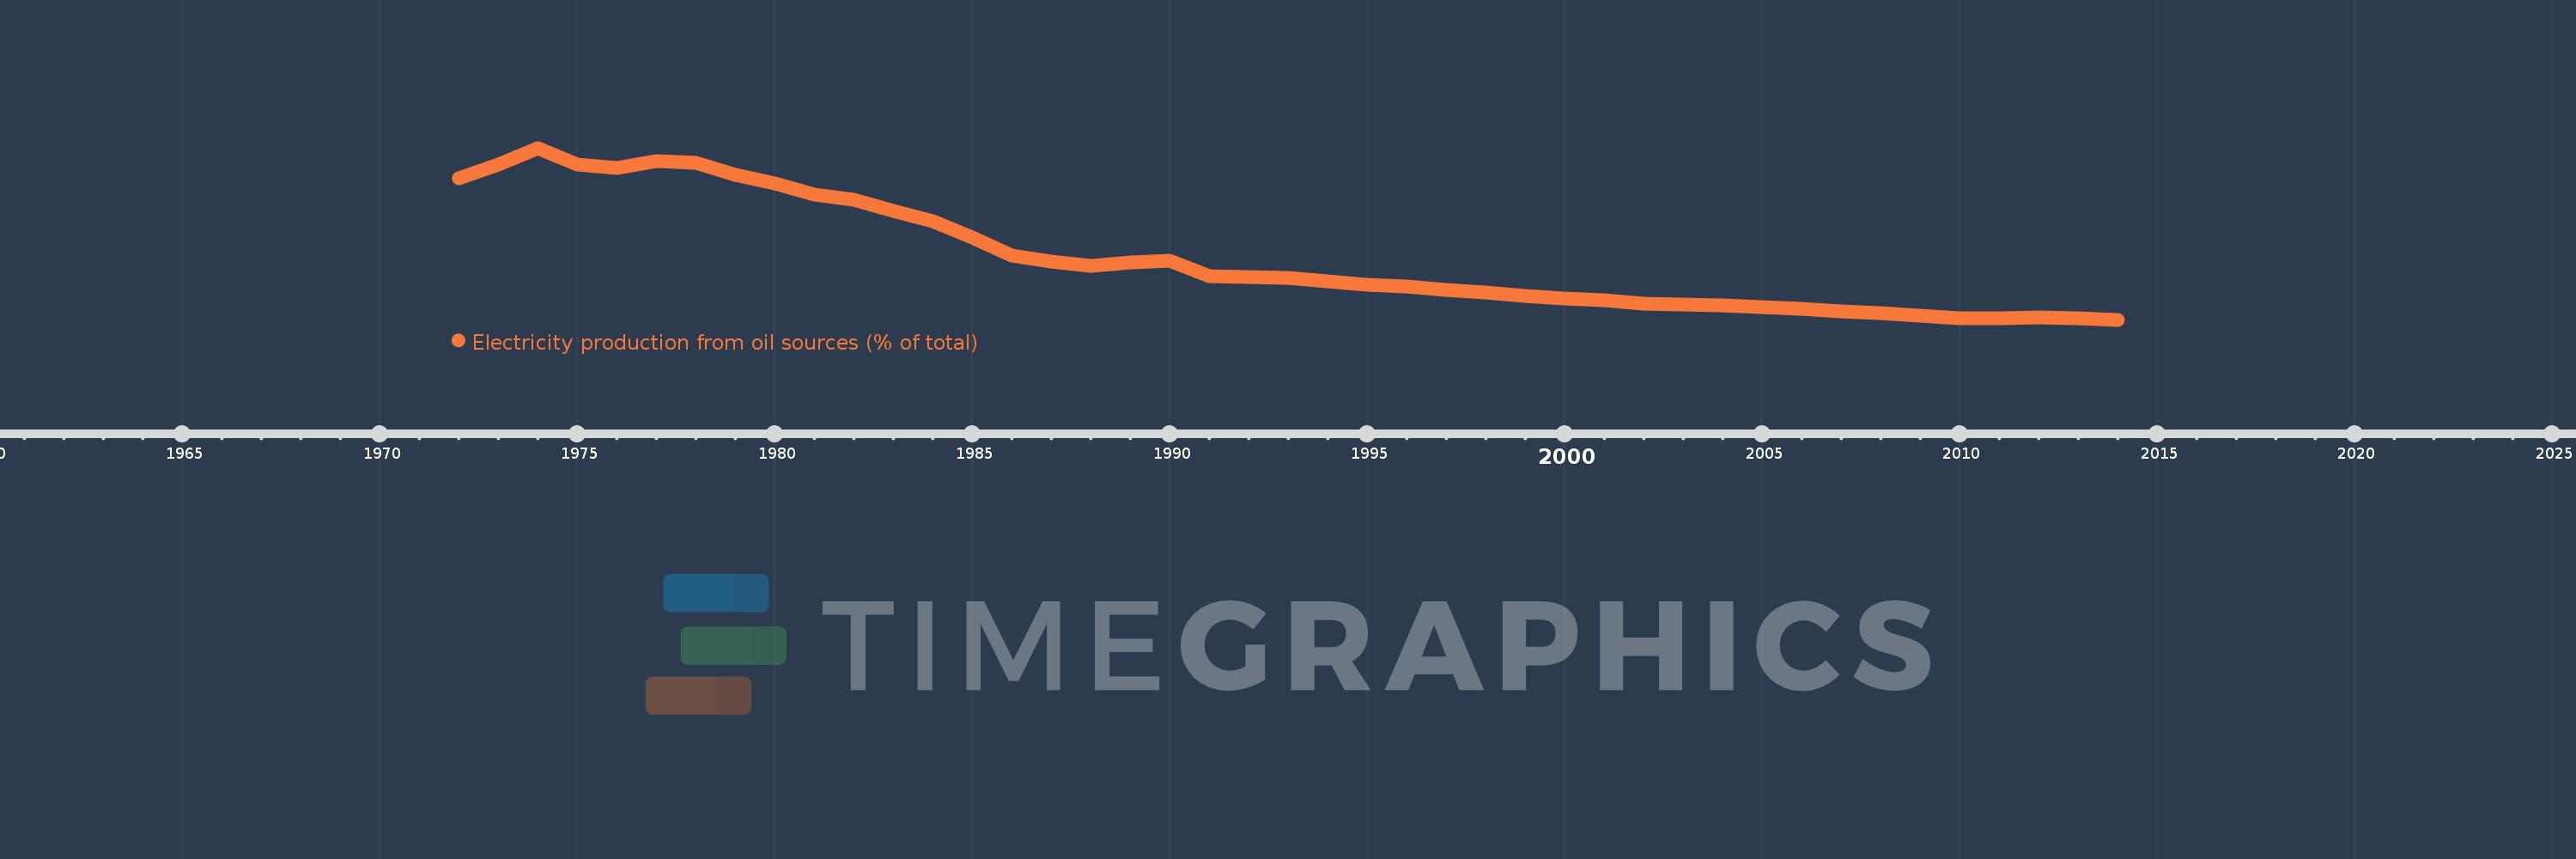
Electricity production from oil sources (% of total)
2014,2013,2012,2011,2010,2009,2008,2007,2006,2005,2004,2003,2002,2001,2000,1999,1998,1997,1996,1995,1994,1993,1992,1991,1990,1989,1988,1987,1986,1985,1984,1983,1982,1981,1980,1979,1978,1977,1976,1975,1974,1973,1972
Estas estadísticas en otros países:
AlbaniaAlgeriaAngolaArab WorldArgentinaArmeniaAustraliaAustriaAzerbaijanBahrainBangladeshBelarusBelgiumBeninBoliviaBosnia and HerzegovinaBotswanaBrazilBrunei DarussalamBulgariaCambodiaCameroonCanadaCentral Europe and the BalticsChileChinaColombiaCongo, Dem. Rep.Congo, Rep.Costa RicaCote d'IvoireCroatiaCubaCuracaoCyprusCzech RepublicDenmarkDominican RepublicEarly-demographic dividendEast Asia & PacificEast Asia & Pacific (excluding high income)East Asia & Pacific (IDA & IBRD countries)EcuadorEgypt, Arab Rep.El SalvadorEritreaEstoniaEthiopiaEuro areaEurope & Central AsiaEurope & Central Asia (excluding high income)Europe & Central Asia (IDA & IBRD countries)European UnionFinlandFragile and conflict affected situationsFranceGabonGeorgiaGermanyGhanaGibraltarGreeceGuatemalaHaitiHeavily indebted poor countries (HIPC)High incomeHondurasHong Kong SAR, ChinaHungaryIBRD onlyIcelandIDA & IBRD totalIDA blendIDA onlyIDA totalIndiaIndonesiaIran, Islamic Rep.IraqIrelandIsraelItalyJamaicaJapanJordanKazakhstanKenyaKorea, Dem. People’s Rep.Korea, Rep.KosovoKuwaitKyrgyz RepublicLate-demographic dividendLatin America & Caribbean Latin America & Caribbean (excluding high income)Latin America & the Caribbean (IDA & IBRD countries)LatviaLeast developed countries: UN classificationLebanonLibyaLithuaniaLow & middle incomeLower middle incomeLuxembourgMacedonia, FYRMalaysiaMaltaMauritiusMexicoMiddle East & North AfricaMiddle East & North Africa (excluding high income)Middle East & North Africa (IDA & IBRD countries)Middle incomeMoldovaMongoliaMontenegroMoroccoMozambiqueMyanmarNamibiaNepalNetherlandsNew ZealandNicaraguaNigerNigeriaNorth AmericaNorwayOECD membersOmanOther small statesPakistanPanamaParaguayPeruPhilippinesPolandPortugalPost-demographic dividendPre-demographic dividendQatarRomaniaRussian FederationSaudi ArabiaSenegalSerbiaSingaporeSlovak RepublicSloveniaSmall statesSouth AfricaSouth AsiaSouth Asia (IDA & IBRD)South SudanSpainSri LankaSub-Saharan Africa Sub-Saharan Africa (excluding high income)Sub-Saharan Africa (IDA & IBRD countries)SudanSwedenSwitzerlandSyrian Arab RepublicTajikistanTanzaniaThailandTogoTrinidad and TobagoTunisiaTurkeyTurkmenistanUkraineUnited Arab EmiratesUnited KingdomUnited StatesUpper middle incomeUruguayUzbekistanVenezuela, RBVietnamWorldYemen, Rep.ZambiaZimbabwe línea de tiempo (timeline):
En esta escala de tiempo se presenta un gráfico de 1972 y 2014 de East Asia & Pacific. Los datos de 1971 están ausentes. El número de observaciones reales por fecha: 43.
Fuente (nombre):
Indicadores del desarrollo mundial
Fuente (organización):
IEA Statistics © OECD/IEA 2014 (http://www.iea.org/stats/index.asp), subject to https://www.iea.org/t&c/termsandconditions/
Categorías:
Energy & Mining, Climate Change, Infrastructure
Se ha actualizado:
23 abr 2017 año
Los indicadores de los cambios de valor en los últimos años
Máximo:
53.647
1 ene 1974 año
A la fecha de observación
Valor
Cambio absoluto
El cambio con respecto al valor anterior
1 ene 1972 año
44.52
+44.52
0.0%
1 ene 1973 año
48.744
+4.224
9.49%
1 ene 1974 año
53.647
+4.903
10.06%
1 ene 1975 año
48.684
-4.962
-9.25%
1 ene 1976 año
47.678
-1.006
-2.07%
1 ene 1977 año
49.583
+1.905
4.0%
1 ene 1978 año
49.086
-0.497
-1.0%
1 ene 1979 año
45.636
-3.45
-7.03%
1 ene 1980 año
42.983
-2.653
-5.81%
1 ene 1981 año
39.75
-3.233
-7.52%
1 ene 1982 año
38.252
-1.499
-3.77%
1 ene 1983 año
34.848
-3.404
-8.9%
1 ene 1984 año
31.735
-3.113
-8.93%
1 ene 1985 año
26.911
-4.824
-15.2%
1 ene 1986 año
21.427
-5.483
-20.38%
1 ene 1987 año
19.52
-1.908
-8.9%
1 ene 1988 año
18.404
-1.116
-5.72%
1 ene 1989 año
19.441
+1.038
5.64%
1 ene 1990 año
19.908
+0.466
2.4%
1 ene 1991 año
15.139
-4.769
-23.96%
1 ene 1992 año
14.96
-0.178
-1.18%
1 ene 1993 año
14.708
-0.253
-1.69%
1 ene 1994 año
13.818
-0.89
-6.05%
1 ene 1995 año
12.696
-1.121
-8.12%
1 ene 1996 año
12.155
-0.542
-4.27%
1 ene 1997 año
11.064
-1.091
-8.97%
1 ene 1998 año
10.441
-0.623
-5.63%
1 ene 1999 año
9.251
-1.189
-11.39%
1 ene 2000 año
8.519
-0.733
-7.92%
1 ene 2001 año
8.116
-0.403
-4.73%
1 ene 2002 año
7.069
-1.047
-12.9%
1 ene 2003 año
6.802
-0.267
-3.78%
1 ene 2004 año
6.433
-0.369
-5.42%
1 ene 2005 año
6.066
-0.368
-5.72%
1 ene 2006 año
5.449
-0.616
-10.16%
1 ene 2007 año
4.579
-0.87
-15.97%
1 ene 2008 año
4.123
-0.456
-9.96%
1 ene 2009 año
3.52
-0.603
-14.62%
1 ene 2010 año
2.721
-0.799
-22.7%
1 ene 2011 año
2.525
-0.196
-7.2%
1 ene 2012 año
2.79
+0.264
10.47%
1 ene 2013 año
2.756
-0.033
-1.2%
1 ene 2014 año
2.2
-0.556
-20.18%
Ranking de los países por los datos estadísticos actuales


Comentarios: