29
/es/
es
AIzaSyAYiBZKx7MnpbEhh9jyipgxe19OcubqV5w
April 1, 2024
141701
Greece
GRC
true
2
1
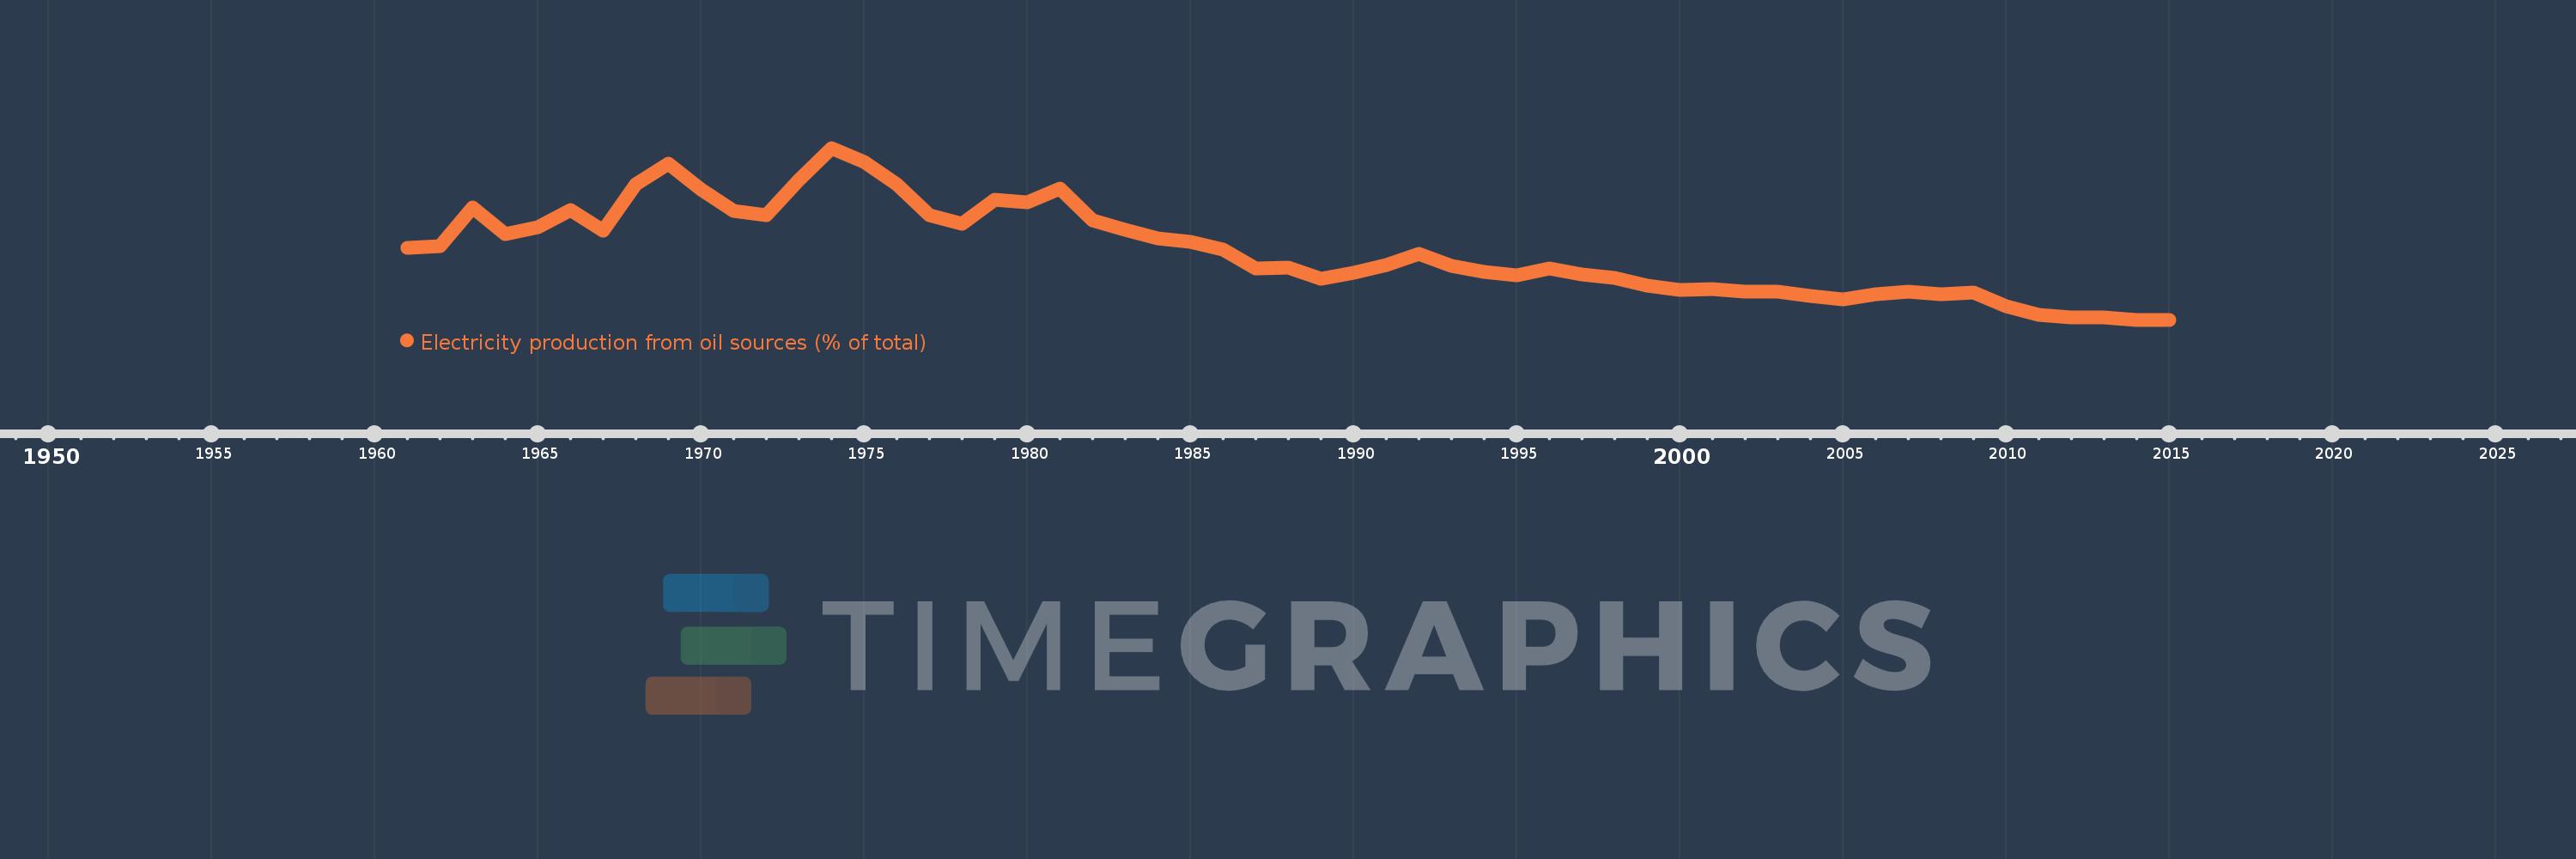
Electricity production from oil sources (% of total)
2015,2014,2013,2012,2011,2010,2009,2008,2007,2006,2005,2004,2003,2002,2001,2000,1999,1998,1997,1996,1995,1994,1993,1992,1991,1990,1989,1988,1987,1986,1985,1984,1983,1982,1981,1980,1979,1978,1977,1976,1975,1974,1973,1972,1971,1970,1969,1968,1967,1966,1965,1964,1963,1962,1961
Estas estadísticas en otros países:
AlbaniaAlgeriaAngolaArab WorldArgentinaArmeniaAustraliaAustriaAzerbaijanBahrainBangladeshBelarusBelgiumBeninBoliviaBosnia and HerzegovinaBotswanaBrazilBrunei DarussalamBulgariaCambodiaCameroonCanadaCentral Europe and the BalticsChileChinaColombiaCongo, Dem. Rep.Congo, Rep.Costa RicaCote d'IvoireCroatiaCubaCuracaoCyprusCzech RepublicDenmarkDominican RepublicEarly-demographic dividendEast Asia & PacificEast Asia & Pacific (excluding high income)East Asia & Pacific (IDA & IBRD countries)EcuadorEgypt, Arab Rep.El SalvadorEritreaEstoniaEthiopiaEuro areaEurope & Central AsiaEurope & Central Asia (excluding high income)Europe & Central Asia (IDA & IBRD countries)European UnionFinlandFragile and conflict affected situationsFranceGabonGeorgiaGermanyGhanaGibraltarGreeceGuatemalaHaitiHeavily indebted poor countries (HIPC)High incomeHondurasHong Kong SAR, ChinaHungaryIBRD onlyIcelandIDA & IBRD totalIDA blendIDA onlyIDA totalIndiaIndonesiaIran, Islamic Rep.IraqIrelandIsraelItalyJamaicaJapanJordanKazakhstanKenyaKorea, Dem. People’s Rep.Korea, Rep.KosovoKuwaitKyrgyz RepublicLate-demographic dividendLatin America & Caribbean Latin America & Caribbean (excluding high income)Latin America & the Caribbean (IDA & IBRD countries)LatviaLeast developed countries: UN classificationLebanonLibyaLithuaniaLow & middle incomeLower middle incomeLuxembourgMacedonia, FYRMalaysiaMaltaMauritiusMexicoMiddle East & North AfricaMiddle East & North Africa (excluding high income)Middle East & North Africa (IDA & IBRD countries)Middle incomeMoldovaMongoliaMontenegroMoroccoMozambiqueMyanmarNamibiaNepalNetherlandsNew ZealandNicaraguaNigerNigeriaNorth AmericaNorwayOECD membersOmanOther small statesPakistanPanamaParaguayPeruPhilippinesPolandPortugalPost-demographic dividendPre-demographic dividendQatarRomaniaRussian FederationSaudi ArabiaSenegalSerbiaSingaporeSlovak RepublicSloveniaSmall statesSouth AfricaSouth AsiaSouth Asia (IDA & IBRD)South SudanSpainSri LankaSub-Saharan Africa Sub-Saharan Africa (excluding high income)Sub-Saharan Africa (IDA & IBRD countries)SudanSwedenSwitzerlandSyrian Arab RepublicTajikistanTanzaniaThailandTogoTrinidad and TobagoTunisiaTurkeyTurkmenistanUkraineUnited Arab EmiratesUnited KingdomUnited StatesUpper middle incomeUruguayUzbekistanVenezuela, RBVietnamWorldYemen, Rep.ZambiaZimbabwe línea de tiempo (timeline):
En esta escala de tiempo se presenta un gráfico de 1961 y 2015 de Greece. Los datos de 1960 están ausentes. El número de observaciones reales por fecha: 55.
Fuente (nombre):
Indicadores del desarrollo mundial
Fuente (organización):
IEA Statistics © OECD/IEA 2014 (http://www.iea.org/stats/index.asp), subject to https://www.iea.org/t&c/termsandconditions/
Categorías:
Energy & Mining, Climate Change, Infrastructure
Se ha actualizado:
23 abr 2017 año
Los indicadores de los cambios de valor en los últimos años
Mínimo:
9.46
1 ene 2015 año
Máximo:
49.544
1 ene 1974 año
A la fecha de observación
Valor
Cambio absoluto
El cambio con respecto al valor anterior
1 ene 1961 año
26.332
+26.332
0.0%
1 ene 1962 año
26.554
+0.222
0.84%
1 ene 1963 año
35.61
+9.056
34.11%
1 ene 1964 año
29.541
-6.069
-17.04%
1 ene 1965 año
30.966
+1.425
4.83%
1 ene 1966 año
35.021
+4.054
13.09%
1 ene 1967 año
30.286
-4.735
-13.52%
1 ene 1968 año
41.028
+10.742
35.47%
1 ene 1969 año
45.798
+4.77
11.63%
1 ene 1970 año
39.957
-5.841
-12.75%
1 ene 1971 año
34.837
-5.12
-12.81%
1 ene 1972 año
33.878
-0.959
-2.75%
1 ene 1973 año
42.108
+8.23
24.29%
1 ene 1974 año
49.544
+7.436
17.66%
1 ene 1975 año
46.305
-3.24
-6.54%
1 ene 1976 año
41.11
-5.195
-11.22%
1 ene 1977 año
33.94
-7.17
-17.44%
1 ene 1978 año
31.846
-2.094
-6.17%
1 ene 1979 año
37.416
+5.569
17.49%
1 ene 1980 año
36.92
-0.496
-1.33%
1 ene 1981 año
40.123
+3.203
8.68%
1 ene 1982 año
32.557
-7.566
-18.86%
1 ene 1983 año
30.354
-2.203
-6.77%
1 ene 1984 año
28.349
-2.005
-6.6%
1 ene 1985 año
27.733
-0.616
-2.17%
1 ene 1986 año
25.811
-1.922
-6.93%
1 ene 1987 año
21.387
-4.424
-17.14%
1 ene 1988 año
21.724
+0.337
1.58%
1 ene 1989 año
19.043
-2.682
-12.34%
1 ene 1990 año
20.514
+1.472
7.73%
1 ene 1991 año
22.275
+1.76
8.58%
1 ene 1992 año
24.752
+2.477
11.12%
1 ene 1993 año
21.991
-2.761
-11.16%
1 ene 1994 año
20.55
-1.441
-6.55%
1 ene 1995 año
19.839
-0.711
-3.46%
1 ene 1996 año
21.453
+1.615
8.14%
1 ene 1997 año
20.122
-1.331
-6.2%
1 ene 1998 año
19.17
-0.952
-4.73%
1 ene 1999 año
17.492
-1.677
-8.75%
1 ene 2000 año
16.514
-0.979
-5.59%
1 ene 2001 año
16.631
+0.117
0.71%
1 ene 2002 año
15.971
-0.659
-3.96%
1 ene 2003 año
16.003
+0.032
0.2%
1 ene 2004 año
15.037
-0.967
-6.04%
1 ene 2005 año
14.257
-0.78
-5.18%
1 ene 2006 año
15.493
+1.236
8.67%
1 ene 2007 año
15.954
+0.461
2.98%
1 ene 2008 año
15.375
-0.579
-3.63%
1 ene 2009 año
15.879
+0.504
3.28%
1 ene 2010 año
12.569
-3.31
-20.85%
1 ene 2011 año
10.614
-1.955
-15.55%
1 ene 2012 año
9.996
-0.618
-5.82%
1 ene 2013 año
10.005
+0.008
0.08%
1 ene 2014 año
9.479
-0.525
-5.25%
1 ene 2015 año
9.46
-0.02
-0.21%
Ranking de los países por los datos estadísticos actuales


Comentarios: