29
/es/
es
AIzaSyAYiBZKx7MnpbEhh9jyipgxe19OcubqV5w
April 1, 2024
139161
Germany
DEU
true
2
1
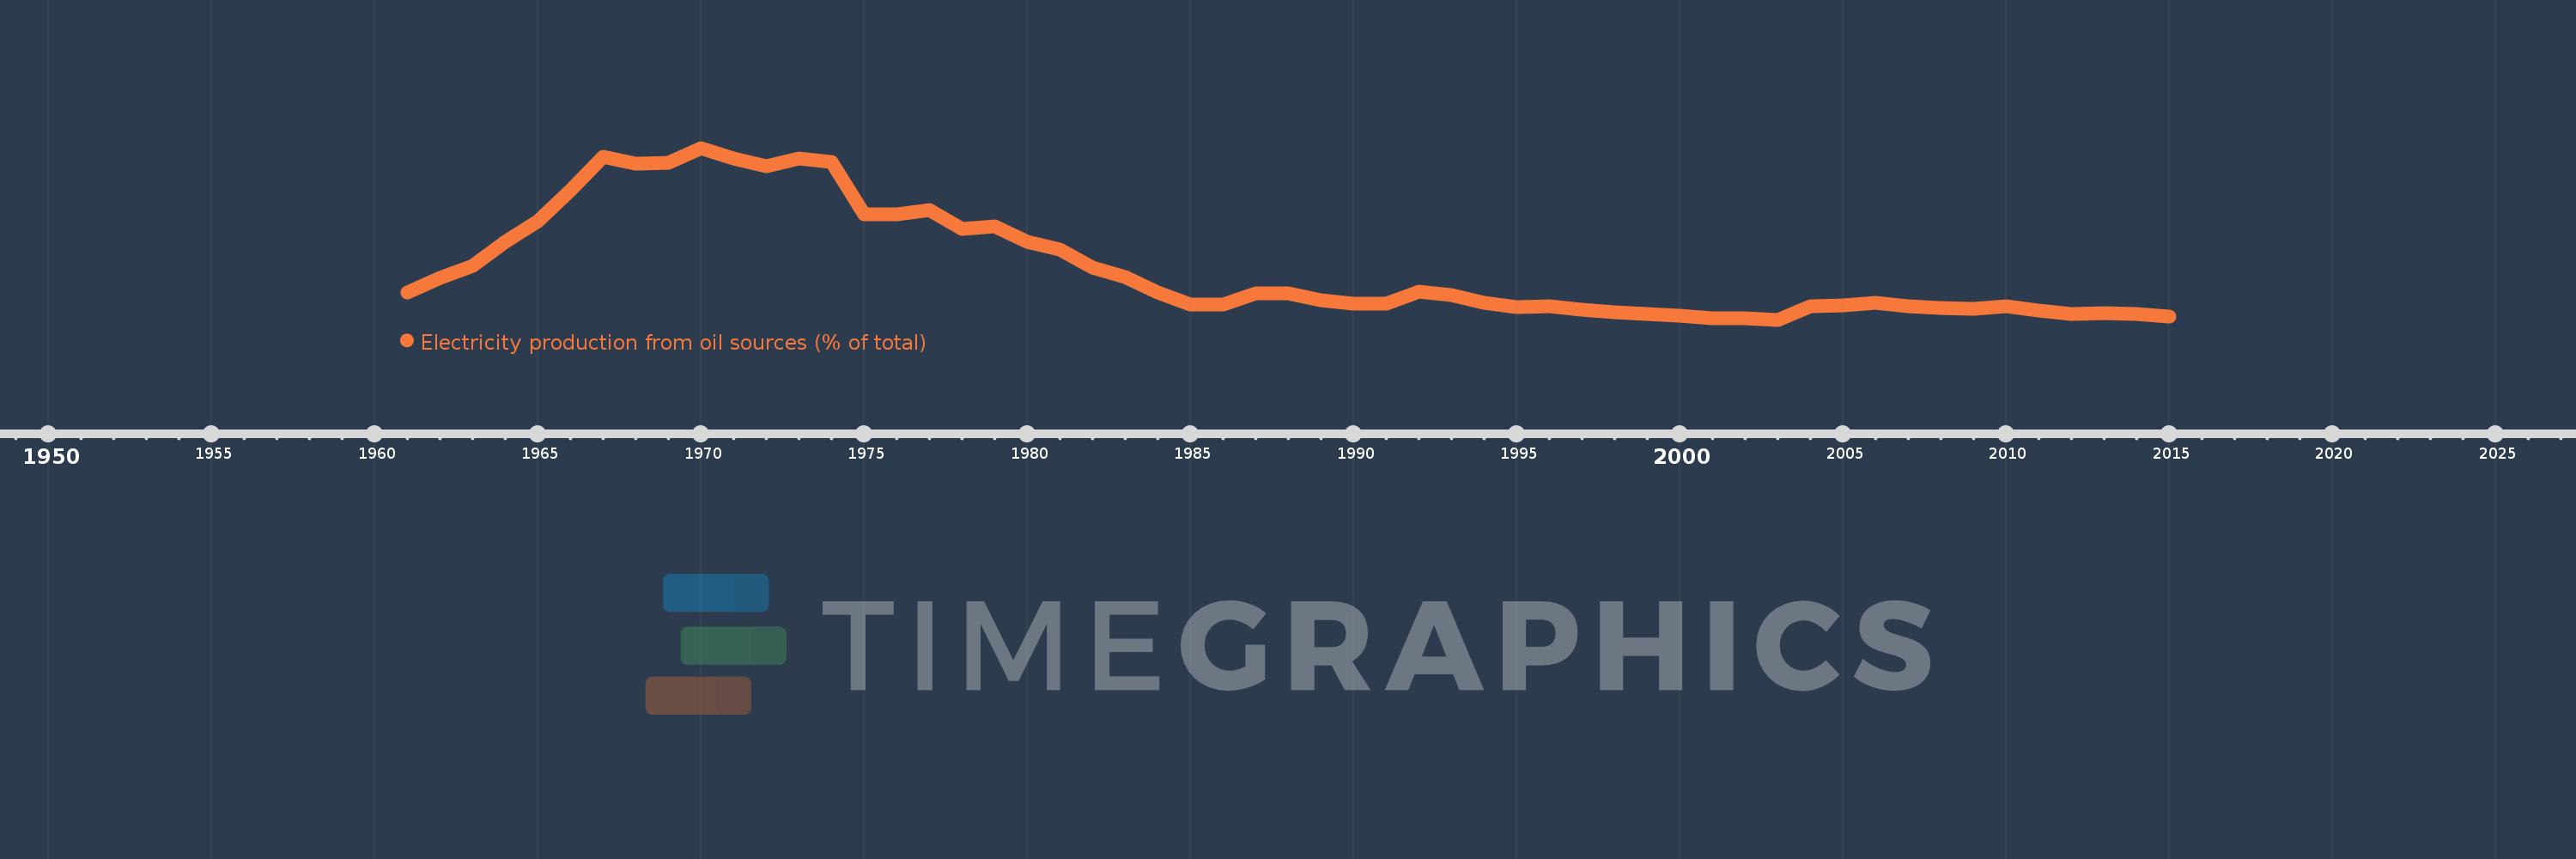
Electricity production from oil sources (% of total)
2015,2014,2013,2012,2011,2010,2009,2008,2007,2006,2005,2004,2003,2002,2001,2000,1999,1998,1997,1996,1995,1994,1993,1992,1991,1990,1989,1988,1987,1986,1985,1984,1983,1982,1981,1980,1979,1978,1977,1976,1975,1974,1973,1972,1971,1970,1969,1968,1967,1966,1965,1964,1963,1962,1961
Estas estadísticas en otros países:
AlbaniaAlgeriaAngolaArab WorldArgentinaArmeniaAustraliaAustriaAzerbaijanBahrainBangladeshBelarusBelgiumBeninBoliviaBosnia and HerzegovinaBotswanaBrazilBrunei DarussalamBulgariaCambodiaCameroonCanadaCentral Europe and the BalticsChileChinaColombiaCongo, Dem. Rep.Congo, Rep.Costa RicaCote d'IvoireCroatiaCubaCuracaoCyprusCzech RepublicDenmarkDominican RepublicEarly-demographic dividendEast Asia & PacificEast Asia & Pacific (excluding high income)East Asia & Pacific (IDA & IBRD countries)EcuadorEgypt, Arab Rep.El SalvadorEritreaEstoniaEthiopiaEuro areaEurope & Central AsiaEurope & Central Asia (excluding high income)Europe & Central Asia (IDA & IBRD countries)European UnionFinlandFragile and conflict affected situationsFranceGabonGeorgiaGermanyGhanaGibraltarGreeceGuatemalaHaitiHeavily indebted poor countries (HIPC)High incomeHondurasHong Kong SAR, ChinaHungaryIBRD onlyIcelandIDA & IBRD totalIDA blendIDA onlyIDA totalIndiaIndonesiaIran, Islamic Rep.IraqIrelandIsraelItalyJamaicaJapanJordanKazakhstanKenyaKorea, Dem. People’s Rep.Korea, Rep.KosovoKuwaitKyrgyz RepublicLate-demographic dividendLatin America & Caribbean Latin America & Caribbean (excluding high income)Latin America & the Caribbean (IDA & IBRD countries)LatviaLeast developed countries: UN classificationLebanonLibyaLithuaniaLow & middle incomeLower middle incomeLuxembourgMacedonia, FYRMalaysiaMaltaMauritiusMexicoMiddle East & North AfricaMiddle East & North Africa (excluding high income)Middle East & North Africa (IDA & IBRD countries)Middle incomeMoldovaMongoliaMontenegroMoroccoMozambiqueMyanmarNamibiaNepalNetherlandsNew ZealandNicaraguaNigerNigeriaNorth AmericaNorwayOECD membersOmanOther small statesPakistanPanamaParaguayPeruPhilippinesPolandPortugalPost-demographic dividendPre-demographic dividendQatarRomaniaRussian FederationSaudi ArabiaSenegalSerbiaSingaporeSlovak RepublicSloveniaSmall statesSouth AfricaSouth AsiaSouth Asia (IDA & IBRD)South SudanSpainSri LankaSub-Saharan Africa Sub-Saharan Africa (excluding high income)Sub-Saharan Africa (IDA & IBRD countries)SudanSwedenSwitzerlandSyrian Arab RepublicTajikistanTanzaniaThailandTogoTrinidad and TobagoTunisiaTurkeyTurkmenistanUkraineUnited Arab EmiratesUnited KingdomUnited StatesUpper middle incomeUruguayUzbekistanVenezuela, RBVietnamWorldYemen, Rep.ZambiaZimbabwe línea de tiempo (timeline):
En esta escala de tiempo se presenta un gráfico de 1961 y 2015 de Germany. Los datos de 1960 están ausentes. El número de observaciones reales por fecha: 55.
Fuente (nombre):
Indicadores del desarrollo mundial
Fuente (organización):
IEA Statistics © OECD/IEA 2014 (http://www.iea.org/stats/index.asp), subject to https://www.iea.org/t&c/termsandconditions/
Categorías:
Energy & Mining, Climate Change, Infrastructure
Se ha actualizado:
23 abr 2017 año
Los indicadores de los cambios de valor en los últimos años
Mínimo:
0.743
1 ene 2003 año
Máximo:
12.974
1 ene 1970 año
A la fecha de observación
Valor
Cambio absoluto
El cambio con respecto al valor anterior
1 ene 1961 año
2.709
+2.709
0.0%
1 ene 1962 año
3.698
+0.99
36.53%
1 ene 1963 año
4.573
+0.875
23.65%
1 ene 1964 año
6.284
+1.711
37.42%
1 ene 1965 año
7.746
+1.462
23.27%
1 ene 1966 año
9.976
+2.23
28.79%
1 ene 1967 año
12.318
+2.341
23.47%
1 ene 1968 año
11.836
-0.481
-3.91%
1 ene 1969 año
11.946
+0.11
0.93%
1 ene 1970 año
12.974
+1.029
8.61%
1 ene 1971 año
12.208
-0.766
-5.9%
1 ene 1972 año
11.66
-0.548
-4.49%
1 ene 1973 año
12.211
+0.551
4.73%
1 ene 1974 año
11.976
-0.235
-1.93%
1 ene 1975 año
8.272
-3.704
-30.93%
1 ene 1976 año
8.249
-0.023
-0.28%
1 ene 1977 año
8.54
+0.291
3.53%
1 ene 1978 año
7.22
-1.32
-15.45%
1 ene 1979 año
7.412
+0.192
2.65%
1 ene 1980 año
6.282
-1.13
-15.25%
1 ene 1981 año
5.734
-0.547
-8.71%
1 ene 1982 año
4.463
-1.272
-22.18%
1 ene 1983 año
3.786
-0.677
-15.17%
1 ene 1984 año
2.681
-1.105
-29.19%
1 ene 1985 año
1.824
-0.857
-31.97%
1 ene 1986 año
1.843
+0.02
1.07%
1 ene 1987 año
2.615
+0.771
41.85%
1 ene 1988 año
2.604
-0.011
-0.42%
1 ene 1989 año
2.156
-0.448
-17.2%
1 ene 1990 año
1.872
-0.283
-13.14%
1 ene 1991 año
1.898
+0.026
1.39%
1 ene 1992 año
2.751
+0.852
44.9%
1 ene 1993 año
2.477
-0.274
-9.97%
1 ene 1994 año
1.931
-0.545
-22.02%
1 ene 1995 año
1.671
-0.261
-13.5%
1 ene 1996 año
1.686
+0.015
0.92%
1 ene 1997 año
1.447
-0.239
-14.2%
1 ene 1998 año
1.253
-0.194
-13.39%
1 ene 1999 año
1.154
-0.099
-7.87%
1 ene 2000 año
1.058
-0.096
-8.36%
1 ene 2001 año
0.836
-0.222
-20.96%
1 ene 2002 año
0.818
-0.018
-2.2%
1 ene 2003 año
0.743
-0.075
-9.17%
1 ene 2004 año
1.712
+0.969
130.5%
1 ene 2005 año
1.763
+0.051
3.0%
1 ene 2006 año
1.948
+0.185
10.49%
1 ene 2007 año
1.731
-0.217
-11.13%
1 ene 2008 año
1.579
-0.152
-8.79%
1 ene 2009 año
1.526
-0.054
-3.4%
1 ene 2010 año
1.706
+0.181
11.84%
1 ene 2011 año
1.395
-0.311
-18.24%
1 ene 2012 año
1.179
-0.216
-15.45%
1 ene 2013 año
1.223
+0.043
3.68%
1 ene 2014 año
1.147
-0.076
-6.17%
1 ene 2015 año
0.992
-0.155
-13.54%
Ranking de los países por los datos estadísticos actuales


Comentarios: