29
/es/
es
AIzaSyAYiBZKx7MnpbEhh9jyipgxe19OcubqV5w
April 1, 2024
281481
Venezuela, RB
VEN
true
2
1
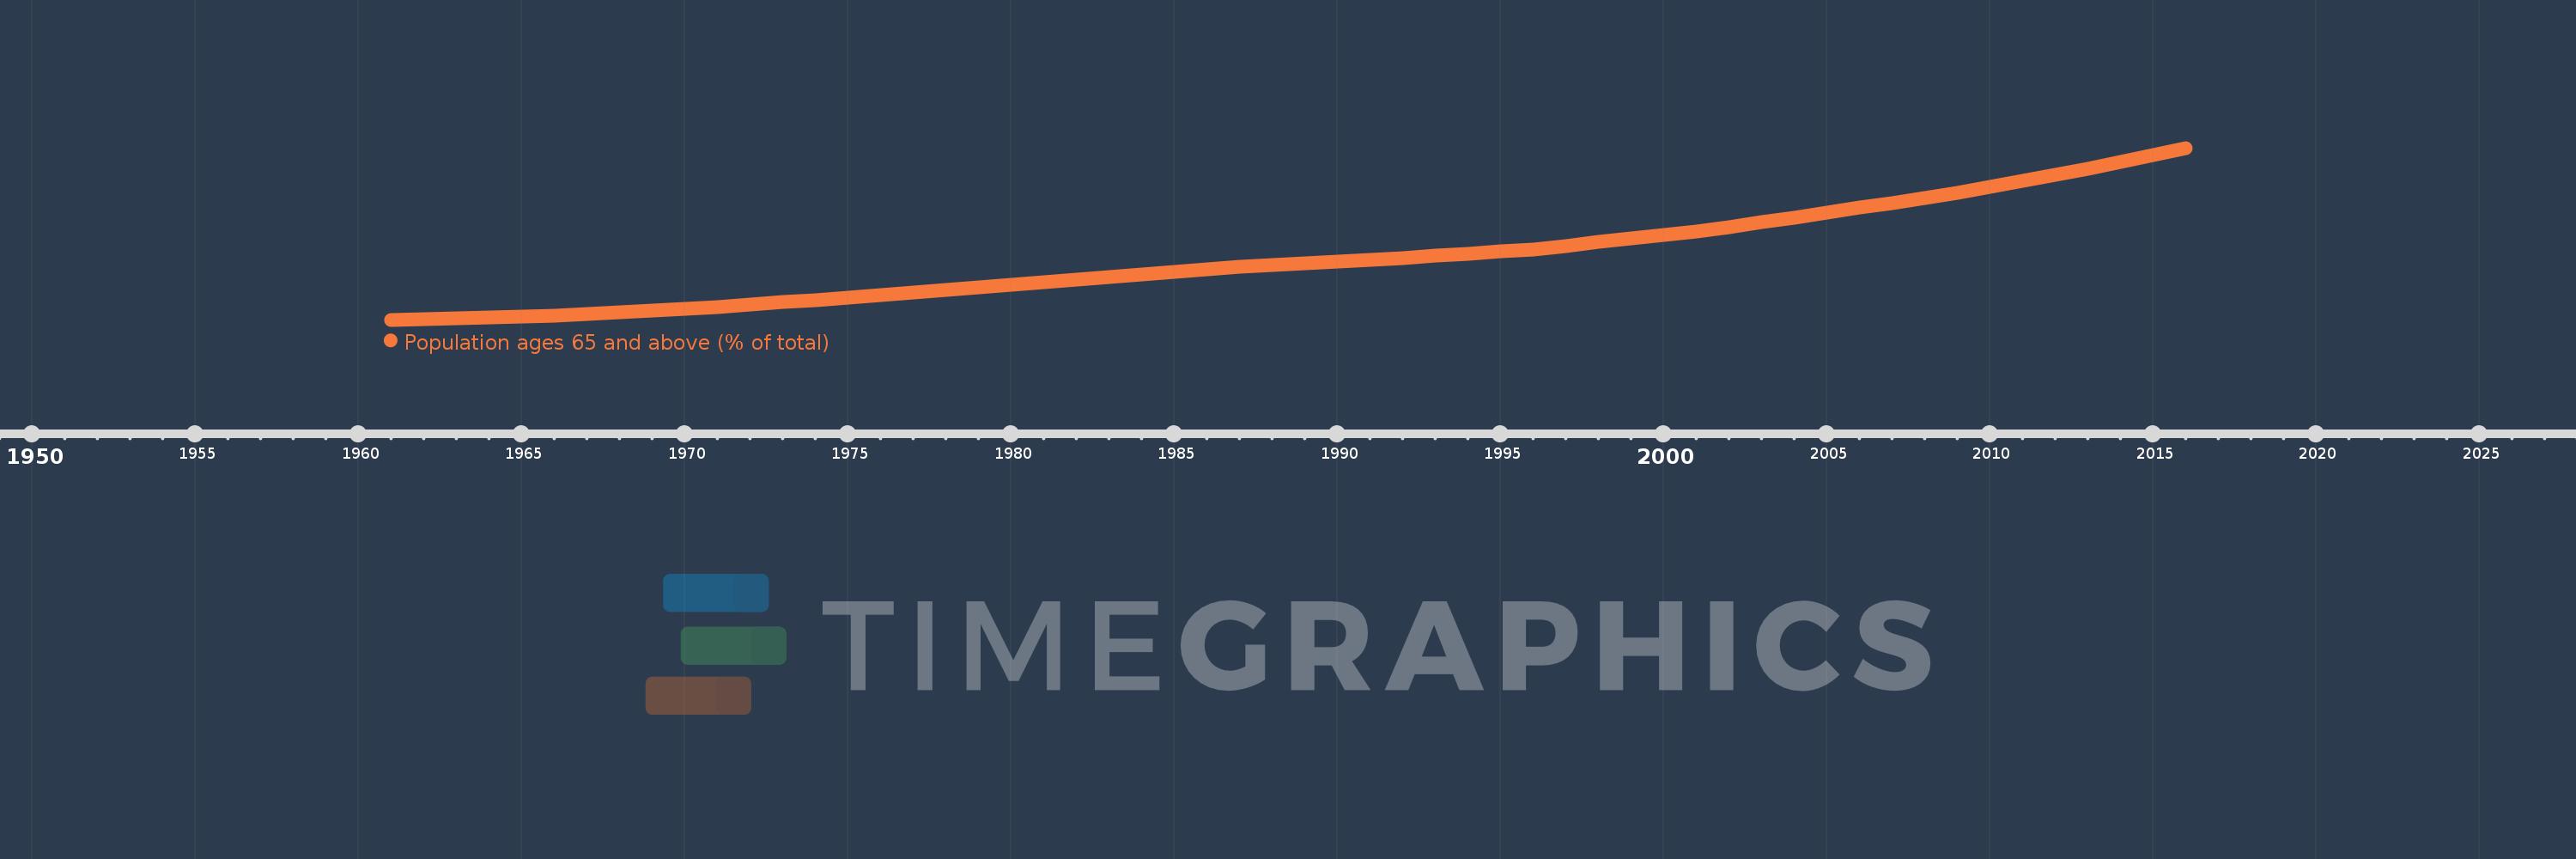
Population ages 65 and above (% of total)
2016,2015,2014,2013,2012,2011,2010,2009,2008,2007,2006,2005,2004,2003,2002,2001,2000,1999,1998,1997,1996,1995,1994,1993,1992,1991,1990,1989,1988,1987,1986,1985,1984,1983,1982,1981,1980,1979,1978,1977,1976,1975,1974,1973,1972,1971,1970,1969,1968,1967,1966,1965,1964,1963,1962,1961
Estas estadísticas en otros países:
AfghanistanAlbaniaAlgeriaAngolaAntigua and BarbudaArab WorldArgentinaArmeniaArubaAustraliaAustriaAzerbaijanBahamas, TheBahrainBangladeshBarbadosBelarusBelgiumBelizeBeninBhutanBoliviaBosnia and HerzegovinaBotswanaBrazilBrunei DarussalamBulgariaBurkina FasoBurundiCabo VerdeCambodiaCameroonCanadaCaribbean small statesCentral African RepublicCentral Europe and the BalticsChadChannel IslandsChileChinaColombiaComorosCongo, Dem. Rep.Congo, Rep.Costa RicaCote d'IvoireCroatiaCubaCuracaoCyprusCzech RepublicDenmarkDjiboutiDominican RepublicEarly-demographic dividendEast Asia & PacificEast Asia & Pacific (excluding high income)East Asia & Pacific (IDA & IBRD countries)EcuadorEgypt, Arab Rep.El SalvadorEquatorial GuineaEritreaEstoniaEthiopiaEuro areaEurope & Central AsiaEurope & Central Asia (excluding high income)Europe & Central Asia (IDA & IBRD countries)European UnionFijiFinlandFragile and conflict affected situationsFranceFrench PolynesiaGabonGambia, TheGeorgiaGermanyGhanaGreeceGrenadaGuamGuatemalaGuineaGuinea-BissauGuyanaHaitiHeavily indebted poor countries (HIPC)High incomeHondurasHong Kong SAR, ChinaHungaryIBRD onlyIcelandIDA & IBRD totalIDA blendIDA onlyIDA totalIndiaIndonesiaIran, Islamic Rep.IraqIrelandIsraelItalyJamaicaJapanJordanKazakhstanKenyaKiribatiKorea, Dem. People’s Rep.Korea, Rep.KosovoKuwaitKyrgyz RepublicLao PDRLate-demographic dividendLatin America & Caribbean Latin America & Caribbean (excluding high income)Latin America & the Caribbean (IDA & IBRD countries)LatviaLeast developed countries: UN classificationLebanonLesothoLiberiaLibyaLithuaniaLow & middle incomeLow incomeLower middle incomeLuxembourgMacao SAR, ChinaMacedonia, FYRMadagascarMalawiMalaysiaMaldivesMaliMaltaMauritaniaMauritiusMexicoMicronesia, Fed. Sts.Middle East & North AfricaMiddle East & North Africa (excluding high income)Middle East & North Africa (IDA & IBRD countries)Middle incomeMoldovaMongoliaMontenegroMoroccoMozambiqueMyanmarNamibiaNepalNetherlandsNew CaledoniaNew ZealandNicaraguaNigerNigeriaNorth AmericaNorwayOECD membersOmanOther small statesPacific island small statesPakistanPanamaPapua New GuineaParaguayPeruPhilippinesPolandPortugalPost-demographic dividendPre-demographic dividendPuerto RicoQatarRomaniaRussian FederationRwandaSamoaSao Tome and PrincipeSaudi ArabiaSenegalSerbiaSeychellesSierra LeoneSingaporeSlovak RepublicSloveniaSmall statesSolomon IslandsSomaliaSouth AfricaSouth AsiaSouth Asia (IDA & IBRD)South SudanSpainSri LankaSt. LuciaSt. Vincent and the GrenadinesSub-Saharan Africa Sub-Saharan Africa (excluding high income)Sub-Saharan Africa (IDA & IBRD countries)SudanSurinameSwazilandSwedenSwitzerlandSyrian Arab RepublicTajikistanTanzaniaThailandTimor-LesteTogoTongaTrinidad and TobagoTunisiaTurkeyTurkmenistanUgandaUkraineUnited Arab EmiratesUnited KingdomUnited StatesUpper middle incomeUruguayUzbekistanVanuatuVenezuela, RBVietnamVirgin Islands (U.S.)West Bank and GazaWorldYemen, Rep.ZambiaZimbabwe línea de tiempo (timeline):
En esta escala de tiempo se presenta un gráfico de 1961 y 2016 de Venezuela, RB. Los datos de 1960 están ausentes. El número de observaciones reales por fecha: 56.
Fuente (nombre):
Indicadores del desarrollo mundial
Fuente (organización):
World Bank staff estimates based on age distributions of United Nations Population Division's World Population Prospects.
Categorías:
Health
Se ha actualizado:
23 abr 2017 año
Los indicadores de los cambios de valor en los últimos años
Mínimo:
2.307
1 ene 1961 año
Máximo:
6.267
1 ene 2016 año
A la fecha de observación
Valor
Cambio absoluto
El cambio con respecto al valor anterior
1 ene 1961 año
2.307
+2.307
0.0%
1 ene 1962 año
2.329
+0.022
0.94%
1 ene 1963 año
2.347
+0.018
0.79%
1 ene 1964 año
2.364
+0.017
0.73%
1 ene 1965 año
2.383
+0.019
0.79%
1 ene 1966 año
2.405
+0.022
0.94%
1 ene 1967 año
2.437
+0.032
1.33%
1 ene 1968 año
2.475
+0.037
1.53%
1 ene 1969 año
2.515
+0.041
1.65%
1 ene 1970 año
2.557
+0.042
1.67%
1 ene 1971 año
2.6
+0.043
1.67%
1 ene 1972 año
2.656
+0.056
2.16%
1 ene 1973 año
2.711
+0.055
2.07%
1 ene 1974 año
2.766
+0.055
2.03%
1 ene 1975 año
2.823
+0.057
2.05%
1 ene 1976 año
2.881
+0.059
2.08%
1 ene 1977 año
2.943
+0.062
2.14%
1 ene 1978 año
3.001
+0.058
1.98%
1 ene 1979 año
3.058
+0.057
1.91%
1 ene 1980 año
3.118
+0.059
1.93%
1 ene 1981 año
3.18
+0.062
2.0%
1 ene 1982 año
3.235
+0.055
1.74%
1 ene 1983 año
3.294
+0.059
1.81%
1 ene 1984 año
3.354
+0.06
1.81%
1 ene 1985 año
3.412
+0.058
1.73%
1 ene 1986 año
3.467
+0.056
1.63%
1 ene 1987 año
3.52
+0.053
1.52%
1 ene 1988 año
3.564
+0.044
1.26%
1 ene 1989 año
3.604
+0.039
1.1%
1 ene 1990 año
3.642
+0.038
1.06%
1 ene 1991 año
3.682
+0.04
1.1%
1 ene 1992 año
3.731
+0.049
1.34%
1 ene 1993 año
3.781
+0.05
1.33%
1 ene 1994 año
3.831
+0.05
1.33%
1 ene 1995 año
3.881
+0.05
1.3%
1 ene 1996 año
3.93
+0.049
1.27%
1 ene 1997 año
4.013
+0.083
2.1%
1 ene 1998 año
4.093
+0.08
2.0%
1 ene 1999 año
4.174
+0.081
1.97%
1 ene 2000 año
4.258
+0.084
2.0%
1 ene 2001 año
4.345
+0.088
2.06%
1 ene 2002 año
4.447
+0.101
2.33%
1 ene 2003 año
4.55
+0.104
2.33%
1 ene 2004 año
4.658
+0.107
2.36%
1 ene 2005 año
4.77
+0.112
2.4%
1 ene 2006 año
4.886
+0.117
2.45%
1 ene 2007 año
5.0
+0.114
2.33%
1 ene 2008 año
5.117
+0.117
2.34%
1 ene 2009 año
5.239
+0.122
2.38%
1 ene 2010 año
5.367
+0.128
2.45%
1 ene 2011 año
5.503
+0.135
2.52%
1 ene 2012 año
5.643
+0.14
2.55%
1 ene 2013 año
5.789
+0.146
2.58%
1 ene 2014 año
5.941
+0.152
2.63%
1 ene 2015 año
6.1
+0.159
2.68%
1 ene 2016 año
6.267
+0.167
2.74%
Ranking de los países por los datos estadísticos actuales


Comentarios: