29
/es/
es
AIzaSyAYiBZKx7MnpbEhh9jyipgxe19OcubqV5w
April 1, 2024
163065
Jamaica
JAM
true
2
1
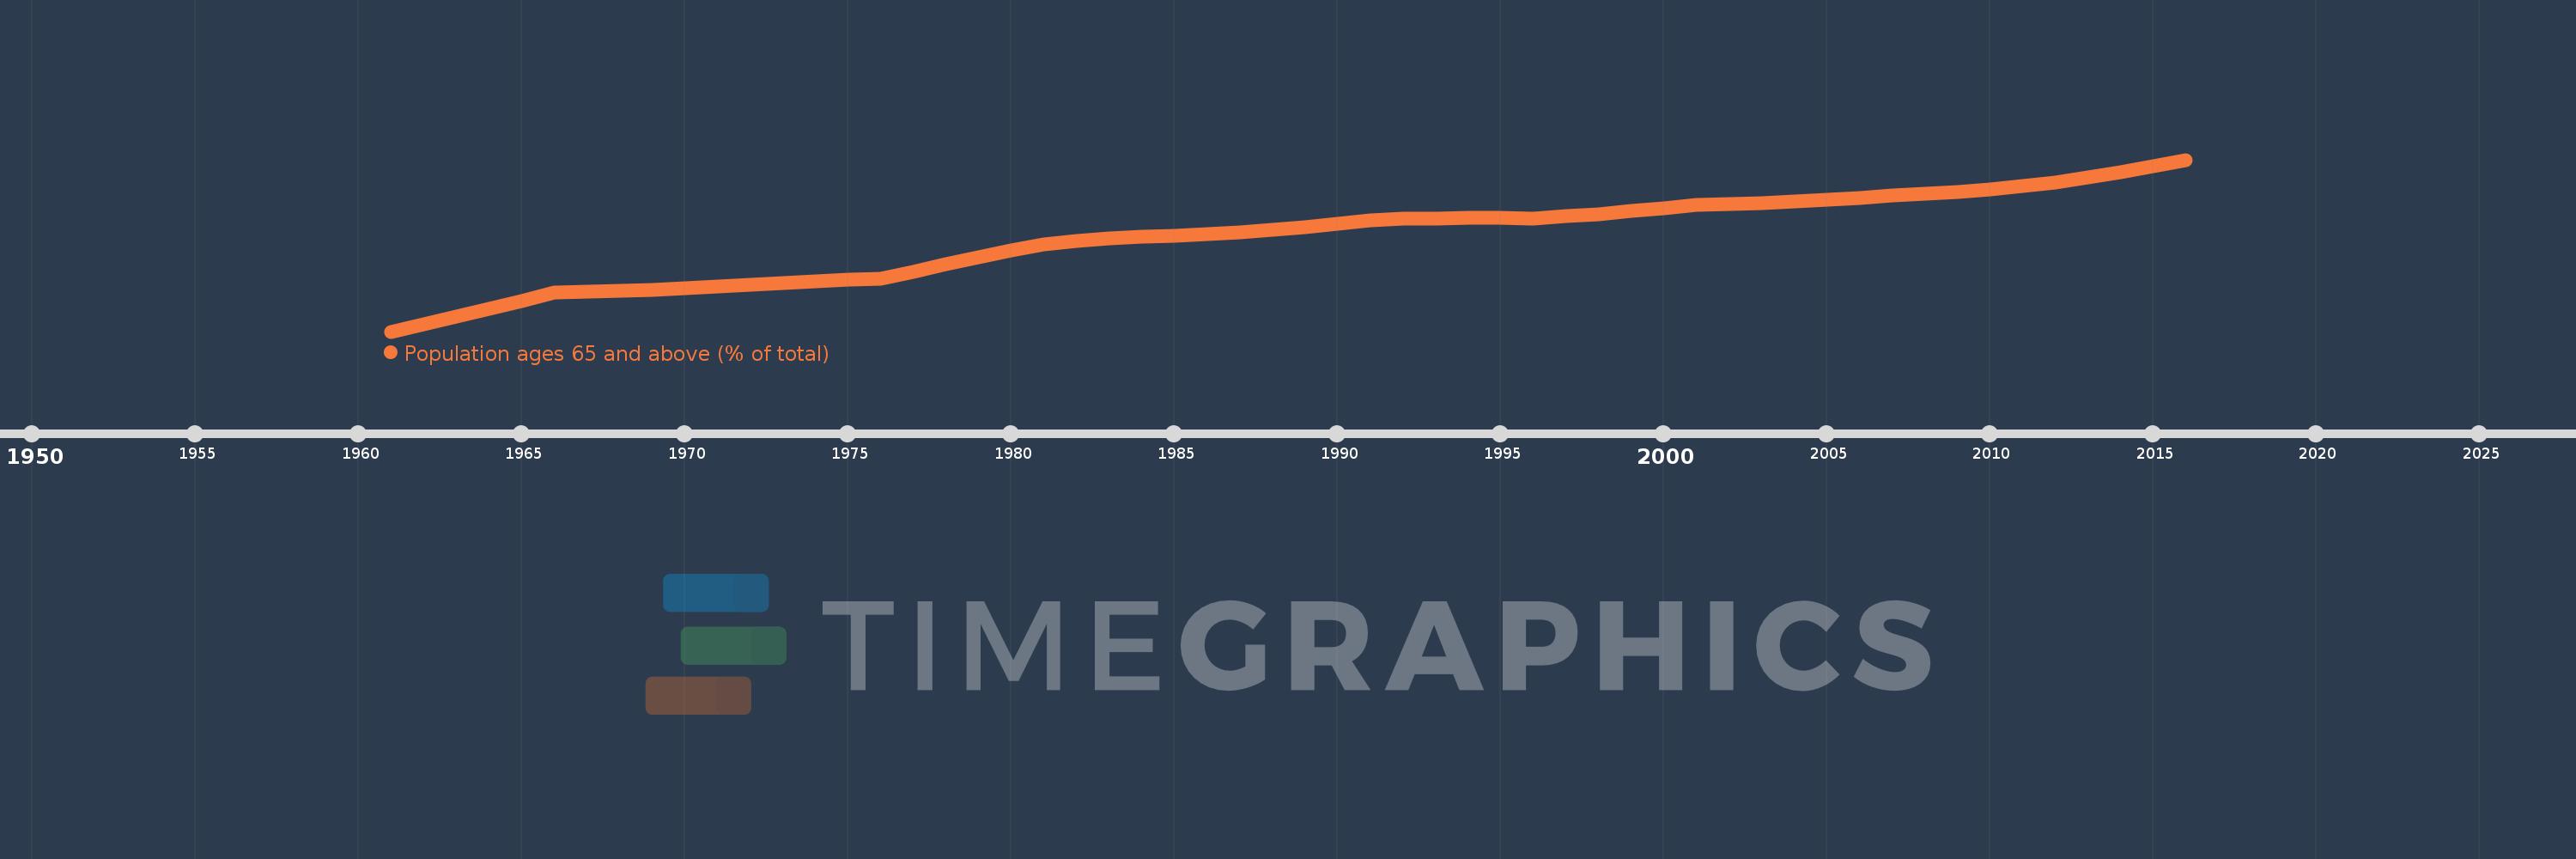
Population ages 65 and above (% of total)
2016,2015,2014,2013,2012,2011,2010,2009,2008,2007,2006,2005,2004,2003,2002,2001,2000,1999,1998,1997,1996,1995,1994,1993,1992,1991,1990,1989,1988,1987,1986,1985,1984,1983,1982,1981,1980,1979,1978,1977,1976,1975,1974,1973,1972,1971,1970,1969,1968,1967,1966,1965,1964,1963,1962,1961
Estas estadísticas en otros países:
AfghanistanAlbaniaAlgeriaAngolaAntigua and BarbudaArab WorldArgentinaArmeniaArubaAustraliaAustriaAzerbaijanBahamas, TheBahrainBangladeshBarbadosBelarusBelgiumBelizeBeninBhutanBoliviaBosnia and HerzegovinaBotswanaBrazilBrunei DarussalamBulgariaBurkina FasoBurundiCabo VerdeCambodiaCameroonCanadaCaribbean small statesCentral African RepublicCentral Europe and the BalticsChadChannel IslandsChileChinaColombiaComorosCongo, Dem. Rep.Congo, Rep.Costa RicaCote d'IvoireCroatiaCubaCuracaoCyprusCzech RepublicDenmarkDjiboutiDominican RepublicEarly-demographic dividendEast Asia & PacificEast Asia & Pacific (excluding high income)East Asia & Pacific (IDA & IBRD countries)EcuadorEgypt, Arab Rep.El SalvadorEquatorial GuineaEritreaEstoniaEthiopiaEuro areaEurope & Central AsiaEurope & Central Asia (excluding high income)Europe & Central Asia (IDA & IBRD countries)European UnionFijiFinlandFragile and conflict affected situationsFranceFrench PolynesiaGabonGambia, TheGeorgiaGermanyGhanaGreeceGrenadaGuamGuatemalaGuineaGuinea-BissauGuyanaHaitiHeavily indebted poor countries (HIPC)High incomeHondurasHong Kong SAR, ChinaHungaryIBRD onlyIcelandIDA & IBRD totalIDA blendIDA onlyIDA totalIndiaIndonesiaIran, Islamic Rep.IraqIrelandIsraelItalyJamaicaJapanJordanKazakhstanKenyaKiribatiKorea, Dem. People’s Rep.Korea, Rep.KosovoKuwaitKyrgyz RepublicLao PDRLate-demographic dividendLatin America & Caribbean Latin America & Caribbean (excluding high income)Latin America & the Caribbean (IDA & IBRD countries)LatviaLeast developed countries: UN classificationLebanonLesothoLiberiaLibyaLithuaniaLow & middle incomeLow incomeLower middle incomeLuxembourgMacao SAR, ChinaMacedonia, FYRMadagascarMalawiMalaysiaMaldivesMaliMaltaMauritaniaMauritiusMexicoMicronesia, Fed. Sts.Middle East & North AfricaMiddle East & North Africa (excluding high income)Middle East & North Africa (IDA & IBRD countries)Middle incomeMoldovaMongoliaMontenegroMoroccoMozambiqueMyanmarNamibiaNepalNetherlandsNew CaledoniaNew ZealandNicaraguaNigerNigeriaNorth AmericaNorwayOECD membersOmanOther small statesPacific island small statesPakistanPanamaPapua New GuineaParaguayPeruPhilippinesPolandPortugalPost-demographic dividendPre-demographic dividendPuerto RicoQatarRomaniaRussian FederationRwandaSamoaSao Tome and PrincipeSaudi ArabiaSenegalSerbiaSeychellesSierra LeoneSingaporeSlovak RepublicSloveniaSmall statesSolomon IslandsSomaliaSouth AfricaSouth AsiaSouth Asia (IDA & IBRD)South SudanSpainSri LankaSt. LuciaSt. Vincent and the GrenadinesSub-Saharan Africa Sub-Saharan Africa (excluding high income)Sub-Saharan Africa (IDA & IBRD countries)SudanSurinameSwazilandSwedenSwitzerlandSyrian Arab RepublicTajikistanTanzaniaThailandTimor-LesteTogoTongaTrinidad and TobagoTunisiaTurkeyTurkmenistanUgandaUkraineUnited Arab EmiratesUnited KingdomUnited StatesUpper middle incomeUruguayUzbekistanVanuatuVenezuela, RBVietnamVirgin Islands (U.S.)West Bank and GazaWorldYemen, Rep.ZambiaZimbabwe línea de tiempo (timeline):
En esta escala de tiempo se presenta un gráfico de 1961 y 2016 de Jamaica. Los datos de 1960 están ausentes. El número de observaciones reales por fecha: 56.
Fuente (nombre):
Indicadores del desarrollo mundial
Fuente (organización):
World Bank staff estimates based on age distributions of United Nations Population Division's World Population Prospects.
Categorías:
Health
Se ha actualizado:
23 abr 2017 año
Los indicadores de los cambios de valor en los últimos años
Mínimo:
4.304
1 ene 1961 año
Máximo:
9.139
1 ene 2016 año
A la fecha de observación
Valor
Cambio absoluto
El cambio con respecto al valor anterior
1 ene 1961 año
4.304
+4.304
0.0%
1 ene 1962 año
4.505
+0.201
4.68%
1 ene 1963 año
4.726
+0.221
4.9%
1 ene 1964 año
4.949
+0.223
4.72%
1 ene 1965 año
5.168
+0.22
4.44%
1 ene 1966 año
5.394
+0.226
4.38%
1 ene 1967 año
5.422
+0.027
0.5%
1 ene 1968 año
5.451
+0.029
0.54%
1 ene 1969 año
5.484
+0.033
0.61%
1 ene 1970 año
5.523
+0.039
0.72%
1 ene 1971 año
5.57
+0.047
0.85%
1 ene 1972 año
5.62
+0.05
0.89%
1 ene 1973 año
5.671
+0.051
0.91%
1 ene 1974 año
5.72
+0.049
0.87%
1 ene 1975 año
5.759
+0.038
0.67%
1 ene 1976 año
5.782
+0.024
0.41%
1 ene 1977 año
5.994
+0.212
3.66%
1 ene 1978 año
6.197
+0.203
3.39%
1 ene 1979 año
6.394
+0.197
3.18%
1 ene 1980 año
6.588
+0.194
3.03%
1 ene 1981 año
6.768
+0.18
2.73%
1 ene 1982 año
6.858
+0.091
1.34%
1 ene 1983 año
6.924
+0.065
0.95%
1 ene 1984 año
6.97
+0.046
0.67%
1 ene 1985 año
7.01
+0.04
0.58%
1 ene 1986 año
7.052
+0.042
0.6%
1 ene 1987 año
7.094
+0.042
0.59%
1 ene 1988 año
7.159
+0.065
0.92%
1 ene 1989 año
7.246
+0.086
1.21%
1 ene 1990 año
7.342
+0.097
1.34%
1 ene 1991 año
7.443
+0.101
1.37%
1 ene 1992 año
7.473
+0.03
0.4%
1 ene 1993 año
7.487
+0.014
0.18%
1 ene 1994 año
7.497
+0.011
0.14%
1 ene 1995 año
7.497
0.0
0.0%
1 ene 1996 año
7.49
-0.007
-0.09%
1 ene 1997 año
7.547
+0.057
0.76%
1 ene 1998 año
7.612
+0.064
0.85%
1 ene 1999 año
7.689
+0.077
1.02%
1 ene 2000 año
7.781
+0.092
1.19%
1 ene 2001 año
7.881
+0.101
1.29%
1 ene 2002 año
7.897
+0.016
0.2%
1 ene 2003 año
7.923
+0.026
0.33%
1 ene 2004 año
7.96
+0.037
0.47%
1 ene 2005 año
8.007
+0.047
0.59%
1 ene 2006 año
8.065
+0.058
0.72%
1 ene 2007 año
8.126
+0.061
0.76%
1 ene 2008 año
8.184
+0.058
0.71%
1 ene 2009 año
8.241
+0.057
0.7%
1 ene 2010 año
8.307
+0.066
0.8%
1 ene 2011 año
8.396
+0.089
1.07%
1 ene 2012 año
8.498
+0.103
1.23%
1 ene 2013 año
8.632
+0.134
1.57%
1 ene 2014 año
8.788
+0.156
1.81%
1 ene 2015 año
8.957
+0.169
1.92%
1 ene 2016 año
9.139
+0.182
2.03%
Ranking de los países por los datos estadísticos actuales


Comentarios: