29
/es/
es
AIzaSyAYiBZKx7MnpbEhh9jyipgxe19OcubqV5w
April 1, 2024
199649
Mongolia
MNG
true
2
1
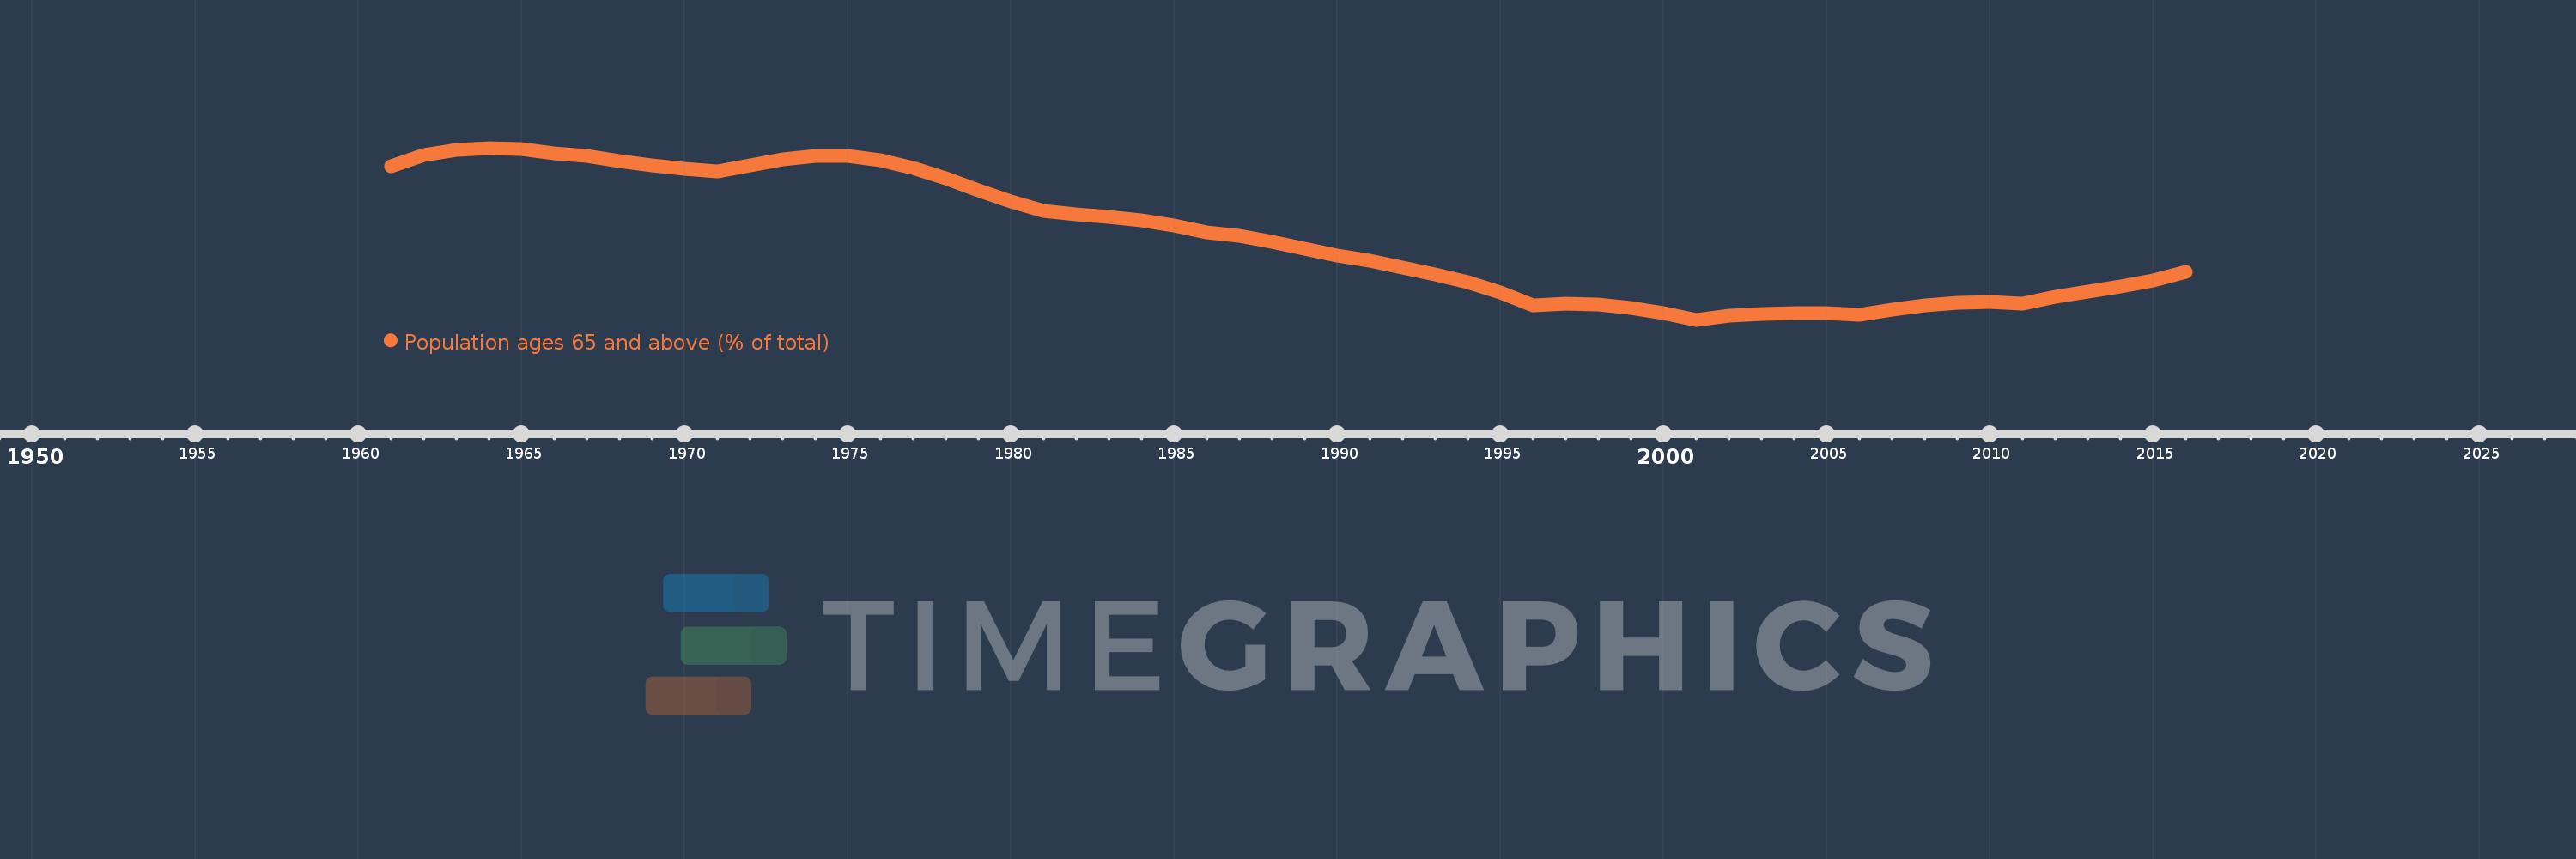
Population ages 65 and above (% of total)
2016,2015,2014,2013,2012,2011,2010,2009,2008,2007,2006,2005,2004,2003,2002,2001,2000,1999,1998,1997,1996,1995,1994,1993,1992,1991,1990,1989,1988,1987,1986,1985,1984,1983,1982,1981,1980,1979,1978,1977,1976,1975,1974,1973,1972,1971,1970,1969,1968,1967,1966,1965,1964,1963,1962,1961
Estas estadísticas en otros países:
AfghanistanAlbaniaAlgeriaAngolaAntigua and BarbudaArab WorldArgentinaArmeniaArubaAustraliaAustriaAzerbaijanBahamas, TheBahrainBangladeshBarbadosBelarusBelgiumBelizeBeninBhutanBoliviaBosnia and HerzegovinaBotswanaBrazilBrunei DarussalamBulgariaBurkina FasoBurundiCabo VerdeCambodiaCameroonCanadaCaribbean small statesCentral African RepublicCentral Europe and the BalticsChadChannel IslandsChileChinaColombiaComorosCongo, Dem. Rep.Congo, Rep.Costa RicaCote d'IvoireCroatiaCubaCuracaoCyprusCzech RepublicDenmarkDjiboutiDominican RepublicEarly-demographic dividendEast Asia & PacificEast Asia & Pacific (excluding high income)East Asia & Pacific (IDA & IBRD countries)EcuadorEgypt, Arab Rep.El SalvadorEquatorial GuineaEritreaEstoniaEthiopiaEuro areaEurope & Central AsiaEurope & Central Asia (excluding high income)Europe & Central Asia (IDA & IBRD countries)European UnionFijiFinlandFragile and conflict affected situationsFranceFrench PolynesiaGabonGambia, TheGeorgiaGermanyGhanaGreeceGrenadaGuamGuatemalaGuineaGuinea-BissauGuyanaHaitiHeavily indebted poor countries (HIPC)High incomeHondurasHong Kong SAR, ChinaHungaryIBRD onlyIcelandIDA & IBRD totalIDA blendIDA onlyIDA totalIndiaIndonesiaIran, Islamic Rep.IraqIrelandIsraelItalyJamaicaJapanJordanKazakhstanKenyaKiribatiKorea, Dem. People’s Rep.Korea, Rep.KosovoKuwaitKyrgyz RepublicLao PDRLate-demographic dividendLatin America & Caribbean Latin America & Caribbean (excluding high income)Latin America & the Caribbean (IDA & IBRD countries)LatviaLeast developed countries: UN classificationLebanonLesothoLiberiaLibyaLithuaniaLow & middle incomeLow incomeLower middle incomeLuxembourgMacao SAR, ChinaMacedonia, FYRMadagascarMalawiMalaysiaMaldivesMaliMaltaMauritaniaMauritiusMexicoMicronesia, Fed. Sts.Middle East & North AfricaMiddle East & North Africa (excluding high income)Middle East & North Africa (IDA & IBRD countries)Middle incomeMoldovaMongoliaMontenegroMoroccoMozambiqueMyanmarNamibiaNepalNetherlandsNew CaledoniaNew ZealandNicaraguaNigerNigeriaNorth AmericaNorwayOECD membersOmanOther small statesPacific island small statesPakistanPanamaPapua New GuineaParaguayPeruPhilippinesPolandPortugalPost-demographic dividendPre-demographic dividendPuerto RicoQatarRomaniaRussian FederationRwandaSamoaSao Tome and PrincipeSaudi ArabiaSenegalSerbiaSeychellesSierra LeoneSingaporeSlovak RepublicSloveniaSmall statesSolomon IslandsSomaliaSouth AfricaSouth AsiaSouth Asia (IDA & IBRD)South SudanSpainSri LankaSt. LuciaSt. Vincent and the GrenadinesSub-Saharan Africa Sub-Saharan Africa (excluding high income)Sub-Saharan Africa (IDA & IBRD countries)SudanSurinameSwazilandSwedenSwitzerlandSyrian Arab RepublicTajikistanTanzaniaThailandTimor-LesteTogoTongaTrinidad and TobagoTunisiaTurkeyTurkmenistanUgandaUkraineUnited Arab EmiratesUnited KingdomUnited StatesUpper middle incomeUruguayUzbekistanVanuatuVenezuela, RBVietnamVirgin Islands (U.S.)West Bank and GazaWorldYemen, Rep.ZambiaZimbabwe línea de tiempo (timeline):
En esta escala de tiempo se presenta un gráfico de 1961 y 2016 de Mongolia. Los datos de 1960 están ausentes. El número de observaciones reales por fecha: 56.
Fuente (nombre):
Indicadores del desarrollo mundial
Fuente (organización):
World Bank staff estimates based on age distributions of United Nations Population Division's World Population Prospects.
Categorías:
Health
Se ha actualizado:
23 abr 2017 año
Los indicadores de los cambios de valor en los últimos años
Mínimo:
3.691
1 ene 2001 año
Máximo:
4.962
1 ene 1964 año
A la fecha de observación
Valor
Cambio absoluto
El cambio con respecto al valor anterior
1 ene 1961 año
4.828
+4.828
0.0%
1 ene 1962 año
4.907
+0.079
1.64%
1 ene 1963 año
4.95
+0.043
0.88%
1 ene 1964 año
4.962
+0.012
0.24%
1 ene 1965 año
4.951
-0.011
-0.22%
1 ene 1966 año
4.925
-0.027
-0.54%
1 ene 1967 año
4.9
-0.024
-0.5%
1 ene 1968 año
4.867
-0.033
-0.67%
1 ene 1969 año
4.834
-0.033
-0.69%
1 ene 1970 año
4.806
-0.028
-0.58%
1 ene 1971 año
4.787
-0.019
-0.39%
1 ene 1972 año
4.836
+0.049
1.02%
1 ene 1973 año
4.88
+0.043
0.89%
1 ene 1974 año
4.906
+0.027
0.55%
1 ene 1975 año
4.904
-0.003
-0.05%
1 ene 1976 año
4.868
-0.035
-0.72%
1 ene 1977 año
4.814
-0.054
-1.11%
1 ene 1978 año
4.736
-0.079
-1.63%
1 ene 1979 año
4.647
-0.089
-1.87%
1 ene 1980 año
4.564
-0.083
-1.79%
1 ene 1981 año
4.495
-0.069
-1.51%
1 ene 1982 año
4.473
-0.022
-0.49%
1 ene 1983 año
4.453
-0.02
-0.45%
1 ene 1984 año
4.428
-0.025
-0.55%
1 ene 1985 año
4.39
-0.038
-0.85%
1 ene 1986 año
4.336
-0.054
-1.23%
1 ene 1987 año
4.309
-0.028
-0.64%
1 ene 1988 año
4.265
-0.043
-1.01%
1 ene 1989 año
4.215
-0.051
-1.19%
1 ene 1990 año
4.167
-0.048
-1.14%
1 ene 1991 año
4.127
-0.04
-0.95%
1 ene 1992 año
4.079
-0.048
-1.16%
1 ene 1993 año
4.028
-0.051
-1.26%
1 ene 1994 año
3.967
-0.061
-1.5%
1 ene 1995 año
3.891
-0.076
-1.91%
1 ene 1996 año
3.8
-0.091
-2.35%
1 ene 1997 año
3.813
+0.013
0.33%
1 ene 1998 año
3.804
-0.008
-0.22%
1 ene 1999 año
3.779
-0.025
-0.67%
1 ene 2000 año
3.741
-0.038
-1.01%
1 ene 2001 año
3.691
-0.05
-1.34%
1 ene 2002 año
3.718
+0.027
0.74%
1 ene 2003 año
3.736
+0.017
0.46%
1 ene 2004 año
3.743
+0.008
0.2%
1 ene 2005 año
3.74
-0.003
-0.09%
1 ene 2006 año
3.725
-0.015
-0.4%
1 ene 2007 año
3.766
+0.041
1.1%
1 ene 2008 año
3.798
+0.032
0.84%
1 ene 2009 año
3.818
+0.02
0.53%
1 ene 2010 año
3.823
+0.005
0.14%
1 ene 2011 año
3.813
-0.011
-0.27%
1 ene 2012 año
3.862
+0.05
1.3%
1 ene 2013 año
3.901
+0.039
1.0%
1 ene 2014 año
3.938
+0.037
0.94%
1 ene 2015 año
3.983
+0.045
1.14%
1 ene 2016 año
4.044
+0.061
1.53%
Ranking de los países por los datos estadísticos actuales


Comentarios: