29
/es/
es
AIzaSyAYiBZKx7MnpbEhh9jyipgxe19OcubqV5w
April 1, 2024
105332
Chile
CHL
true
2
1
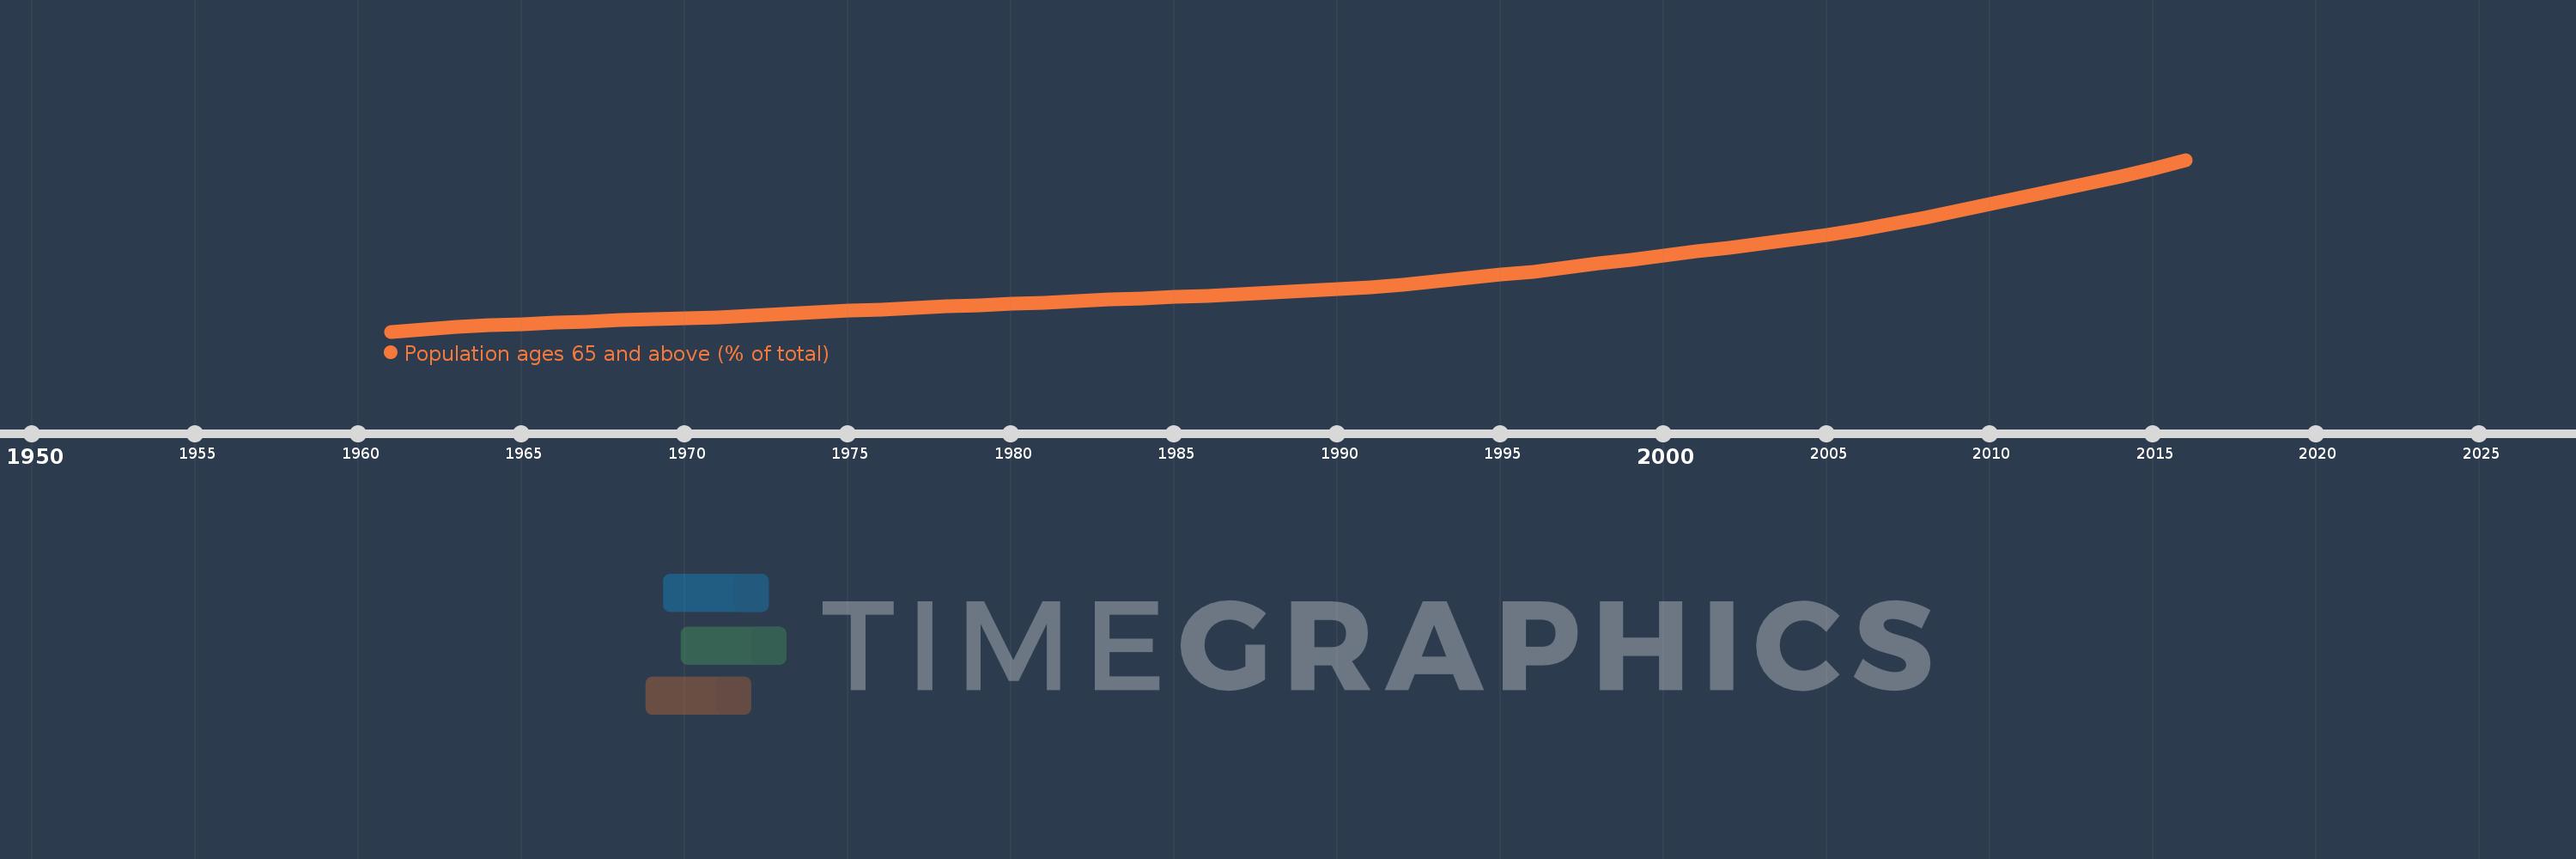
Population ages 65 and above (% of total)
2016,2015,2014,2013,2012,2011,2010,2009,2008,2007,2006,2005,2004,2003,2002,2001,2000,1999,1998,1997,1996,1995,1994,1993,1992,1991,1990,1989,1988,1987,1986,1985,1984,1983,1982,1981,1980,1979,1978,1977,1976,1975,1974,1973,1972,1971,1970,1969,1968,1967,1966,1965,1964,1963,1962,1961
Estas estadísticas en otros países:
AfghanistanAlbaniaAlgeriaAngolaAntigua and BarbudaArab WorldArgentinaArmeniaArubaAustraliaAustriaAzerbaijanBahamas, TheBahrainBangladeshBarbadosBelarusBelgiumBelizeBeninBhutanBoliviaBosnia and HerzegovinaBotswanaBrazilBrunei DarussalamBulgariaBurkina FasoBurundiCabo VerdeCambodiaCameroonCanadaCaribbean small statesCentral African RepublicCentral Europe and the BalticsChadChannel IslandsChileChinaColombiaComorosCongo, Dem. Rep.Congo, Rep.Costa RicaCote d'IvoireCroatiaCubaCuracaoCyprusCzech RepublicDenmarkDjiboutiDominican RepublicEarly-demographic dividendEast Asia & PacificEast Asia & Pacific (excluding high income)East Asia & Pacific (IDA & IBRD countries)EcuadorEgypt, Arab Rep.El SalvadorEquatorial GuineaEritreaEstoniaEthiopiaEuro areaEurope & Central AsiaEurope & Central Asia (excluding high income)Europe & Central Asia (IDA & IBRD countries)European UnionFijiFinlandFragile and conflict affected situationsFranceFrench PolynesiaGabonGambia, TheGeorgiaGermanyGhanaGreeceGrenadaGuamGuatemalaGuineaGuinea-BissauGuyanaHaitiHeavily indebted poor countries (HIPC)High incomeHondurasHong Kong SAR, ChinaHungaryIBRD onlyIcelandIDA & IBRD totalIDA blendIDA onlyIDA totalIndiaIndonesiaIran, Islamic Rep.IraqIrelandIsraelItalyJamaicaJapanJordanKazakhstanKenyaKiribatiKorea, Dem. People’s Rep.Korea, Rep.KosovoKuwaitKyrgyz RepublicLao PDRLate-demographic dividendLatin America & Caribbean Latin America & Caribbean (excluding high income)Latin America & the Caribbean (IDA & IBRD countries)LatviaLeast developed countries: UN classificationLebanonLesothoLiberiaLibyaLithuaniaLow & middle incomeLow incomeLower middle incomeLuxembourgMacao SAR, ChinaMacedonia, FYRMadagascarMalawiMalaysiaMaldivesMaliMaltaMauritaniaMauritiusMexicoMicronesia, Fed. Sts.Middle East & North AfricaMiddle East & North Africa (excluding high income)Middle East & North Africa (IDA & IBRD countries)Middle incomeMoldovaMongoliaMontenegroMoroccoMozambiqueMyanmarNamibiaNepalNetherlandsNew CaledoniaNew ZealandNicaraguaNigerNigeriaNorth AmericaNorwayOECD membersOmanOther small statesPacific island small statesPakistanPanamaPapua New GuineaParaguayPeruPhilippinesPolandPortugalPost-demographic dividendPre-demographic dividendPuerto RicoQatarRomaniaRussian FederationRwandaSamoaSao Tome and PrincipeSaudi ArabiaSenegalSerbiaSeychellesSierra LeoneSingaporeSlovak RepublicSloveniaSmall statesSolomon IslandsSomaliaSouth AfricaSouth AsiaSouth Asia (IDA & IBRD)South SudanSpainSri LankaSt. LuciaSt. Vincent and the GrenadinesSub-Saharan Africa Sub-Saharan Africa (excluding high income)Sub-Saharan Africa (IDA & IBRD countries)SudanSurinameSwazilandSwedenSwitzerlandSyrian Arab RepublicTajikistanTanzaniaThailandTimor-LesteTogoTongaTrinidad and TobagoTunisiaTurkeyTurkmenistanUgandaUkraineUnited Arab EmiratesUnited KingdomUnited StatesUpper middle incomeUruguayUzbekistanVanuatuVenezuela, RBVietnamVirgin Islands (U.S.)West Bank and GazaWorldYemen, Rep.ZambiaZimbabwe línea de tiempo (timeline):
En esta escala de tiempo se presenta un gráfico de 1961 y 2016 de Chile. Los datos de 1960 están ausentes. El número de observaciones reales por fecha: 56.
Fuente (nombre):
Indicadores del desarrollo mundial
Fuente (organización):
World Bank staff estimates based on age distributions of United Nations Population Division's World Population Prospects.
Categorías:
Health
Se ha actualizado:
23 abr 2017 año
Los indicadores de los cambios de valor en los últimos años
Mínimo:
4.929
1 ene 1961 año
Máximo:
11.003
1 ene 2016 año
A la fecha de observación
Valor
Cambio absoluto
El cambio con respecto al valor anterior
1 ene 1961 año
4.929
+4.929
0.0%
1 ene 1962 año
5.011
+0.082
1.67%
1 ene 1963 año
5.081
+0.07
1.4%
1 ene 1964 año
5.142
+0.06
1.19%
1 ene 1965 año
5.195
+0.053
1.03%
1 ene 1966 año
5.241
+0.047
0.9%
1 ene 1967 año
5.289
+0.047
0.9%
1 ene 1968 año
5.327
+0.038
0.72%
1 ene 1969 año
5.361
+0.034
0.64%
1 ene 1970 año
5.397
+0.036
0.67%
1 ene 1971 año
5.438
+0.042
0.77%
1 ene 1972 año
5.494
+0.056
1.02%
1 ene 1973 año
5.555
+0.061
1.11%
1 ene 1974 año
5.616
+0.061
1.09%
1 ene 1975 año
5.669
+0.052
0.93%
1 ene 1976 año
5.709
+0.041
0.72%
1 ene 1977 año
5.774
+0.065
1.14%
1 ene 1978 año
5.824
+0.05
0.87%
1 ene 1979 año
5.865
+0.041
0.7%
1 ene 1980 año
5.903
+0.038
0.65%
1 ene 1981 año
5.942
+0.039
0.66%
1 ene 1982 año
5.999
+0.057
0.96%
1 ene 1983 año
6.054
+0.055
0.92%
1 ene 1984 año
6.106
+0.052
0.87%
1 ene 1985 año
6.154
+0.048
0.79%
1 ene 1986 año
6.198
+0.043
0.7%
1 ene 1987 año
6.257
+0.06
0.96%
1 ene 1988 año
6.311
+0.054
0.86%
1 ene 1989 año
6.364
+0.053
0.84%
1 ene 1990 año
6.423
+0.059
0.92%
1 ene 1991 año
6.492
+0.069
1.08%
1 ene 1992 año
6.587
+0.095
1.47%
1 ene 1993 año
6.696
+0.109
1.65%
1 ene 1994 año
6.814
+0.118
1.75%
1 ene 1995 año
6.934
+0.12
1.76%
1 ene 1996 año
7.053
+0.12
1.73%
1 ene 1997 año
7.195
+0.142
2.01%
1 ene 1998 año
7.336
+0.141
1.96%
1 ene 1999 año
7.477
+0.141
1.93%
1 ene 2000 año
7.62
+0.143
1.91%
1 ene 2001 año
7.764
+0.145
1.9%
1 ene 2002 año
7.905
+0.141
1.81%
1 ene 2003 año
8.045
+0.14
1.77%
1 ene 2004 año
8.191
+0.146
1.82%
1 ene 2005 año
8.353
+0.162
1.98%
1 ene 2006 año
8.538
+0.185
2.21%
1 ene 2007 año
8.736
+0.198
2.32%
1 ene 2008 año
8.954
+0.218
2.5%
1 ene 2009 año
9.188
+0.234
2.61%
1 ene 2010 año
9.429
+0.242
2.63%
1 ene 2011 año
9.675
+0.246
2.6%
1 ene 2012 año
9.916
+0.242
2.5%
1 ene 2013 año
10.163
+0.246
2.48%
1 ene 2014 año
10.42
+0.257
2.53%
1 ene 2015 año
10.698
+0.278
2.67%
1 ene 2016 año
11.003
+0.305
2.85%
Ranking de los países por los datos estadísticos actuales


Comentarios: