29
/es/
es
AIzaSyAYiBZKx7MnpbEhh9jyipgxe19OcubqV5w
April 1, 2024
27462
East Asia & Pacific
EAS
false
2
1
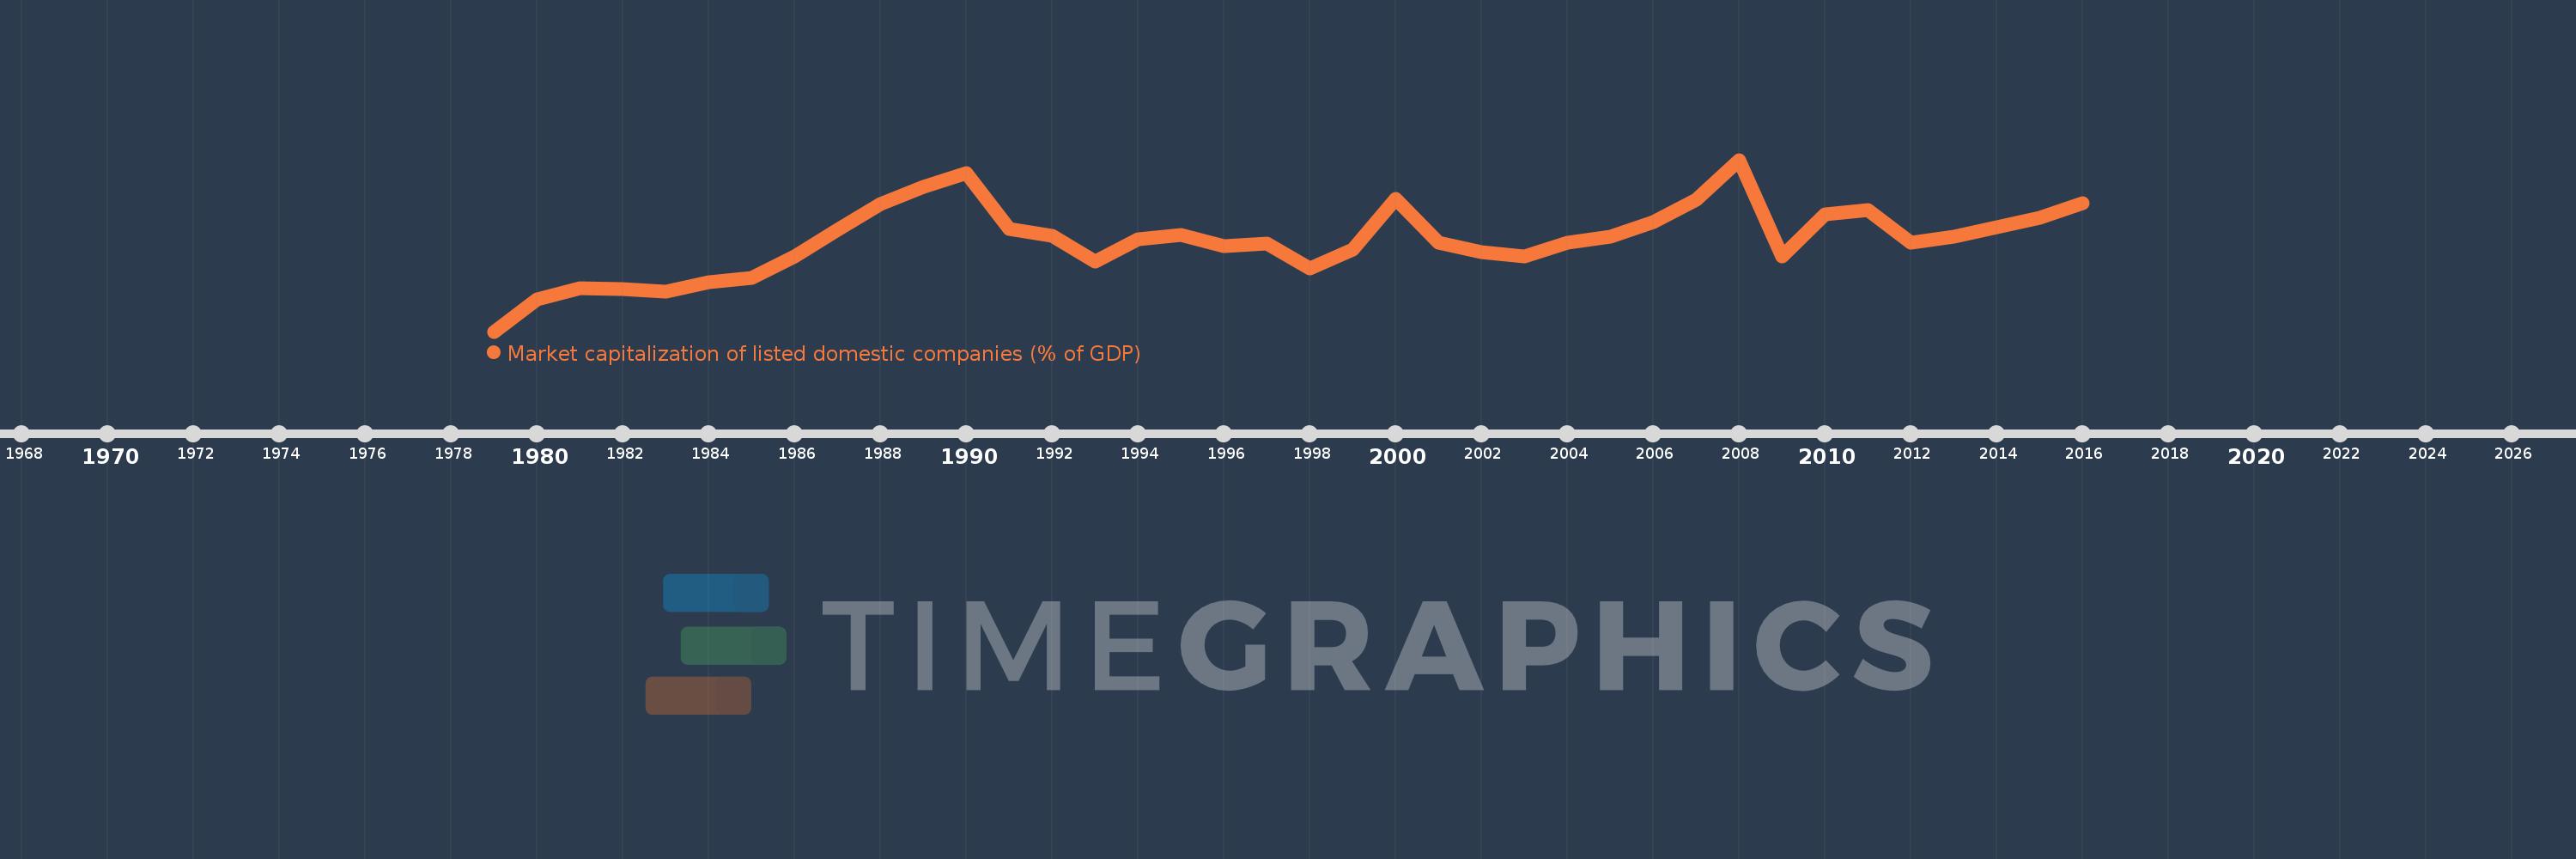
Market capitalization of listed domestic companies (% of GDP)
2016,2015,2014,2013,2012,2011,2010,2009,2008,2007,2006,2005,2004,2003,2002,2001,2000,1999,1998,1997,1996,1995,1994,1993,1992,1991,1990,1989,1988,1987,1986,1985,1984,1983,1982,1981,1980,1979
Estas estadísticas en otros países:
línea de tiempo (timeline):
En esta escala de tiempo se presenta un gráfico de 1979 y 2016 de East Asia & Pacific. Los datos de 1978 están ausentes. El número de observaciones reales por fecha: 38.
Fuente (nombre):
Indicadores del desarrollo mundial
Fuente (organización):
World Federation of Exchanges database.
Categorías:
Financial Sector
Se ha actualizado:
23 abr 2017 año
Los indicadores de los cambios de valor en los últimos años
Mínimo:
4.643
1 ene 1979 año
Máximo:
135.187
1 ene 2008 año
A la fecha de observación
Valor
Cambio absoluto
El cambio con respecto al valor anterior
1 ene 1979 año
4.643
+4.643
0.0%
1 ene 1980 año
28.996
+24.353
524.52%
1 ene 1981 año
37.626
+8.63
29.76%
1 ene 1982 año
37.104
-0.522
-1.39%
1 ene 1983 año
34.801
-2.303
-6.21%
1 ene 1984 año
42.343
+7.542
21.67%
1 ene 1985 año
45.121
+2.778
6.56%
1 ene 1986 año
61.47
+16.348
36.23%
1 ene 1987 año
81.933
+20.463
33.29%
1 ene 1988 año
101.692
+19.759
24.12%
1 ene 1989 año
114.838
+13.146
12.93%
1 ene 1990 año
125.001
+10.163
8.85%
1 ene 1991 año
82.818
-42.183
-33.75%
1 ene 1992 año
77.529
-5.288
-6.39%
1 ene 1993 año
58.158
-19.371
-24.99%
1 ene 1994 año
74.94
+16.782
28.86%
1 ene 1995 año
78.281
+3.341
4.46%
1 ene 1996 año
69.355
-8.927
-11.4%
1 ene 1997 año
71.557
+2.203
3.18%
1 ene 1998 año
52.696
-18.861
-26.36%
1 ene 1999 año
67.291
+14.595
27.7%
1 ene 2000 año
105.405
+38.114
56.64%
1 ene 2001 año
72.324
-33.081
-31.38%
1 ene 2002 año
65.261
-7.063
-9.77%
1 ene 2003 año
62.01
-3.251
-4.98%
1 ene 2004 año
72.35
+10.34
16.68%
1 ene 2005 año
76.889
+4.539
6.27%
1 ene 2006 año
88.137
+11.248
14.63%
1 ene 2007 año
104.583
+16.446
18.66%
1 ene 2008 año
135.187
+30.604
29.26%
1 ene 2009 año
61.752
-73.434
-54.32%
1 ene 2010 año
93.851
+32.099
51.98%
1 ene 2011 año
96.721
+2.87
3.06%
1 ene 2012 año
72.111
-24.61
-25.44%
1 ene 2013 año
77.003
+4.892
6.78%
1 ene 2014 año
83.637
+6.635
8.62%
1 ene 2015 año
91.237
+7.599
9.09%
1 ene 2016 año
101.989
+10.752
11.78%
Ranking de los países por los datos estadísticos actuales


Comentarios: