29
/es/
es
AIzaSyAYiBZKx7MnpbEhh9jyipgxe19OcubqV5w
April 1, 2024
242843
Slovenia
SVN
true
2
1
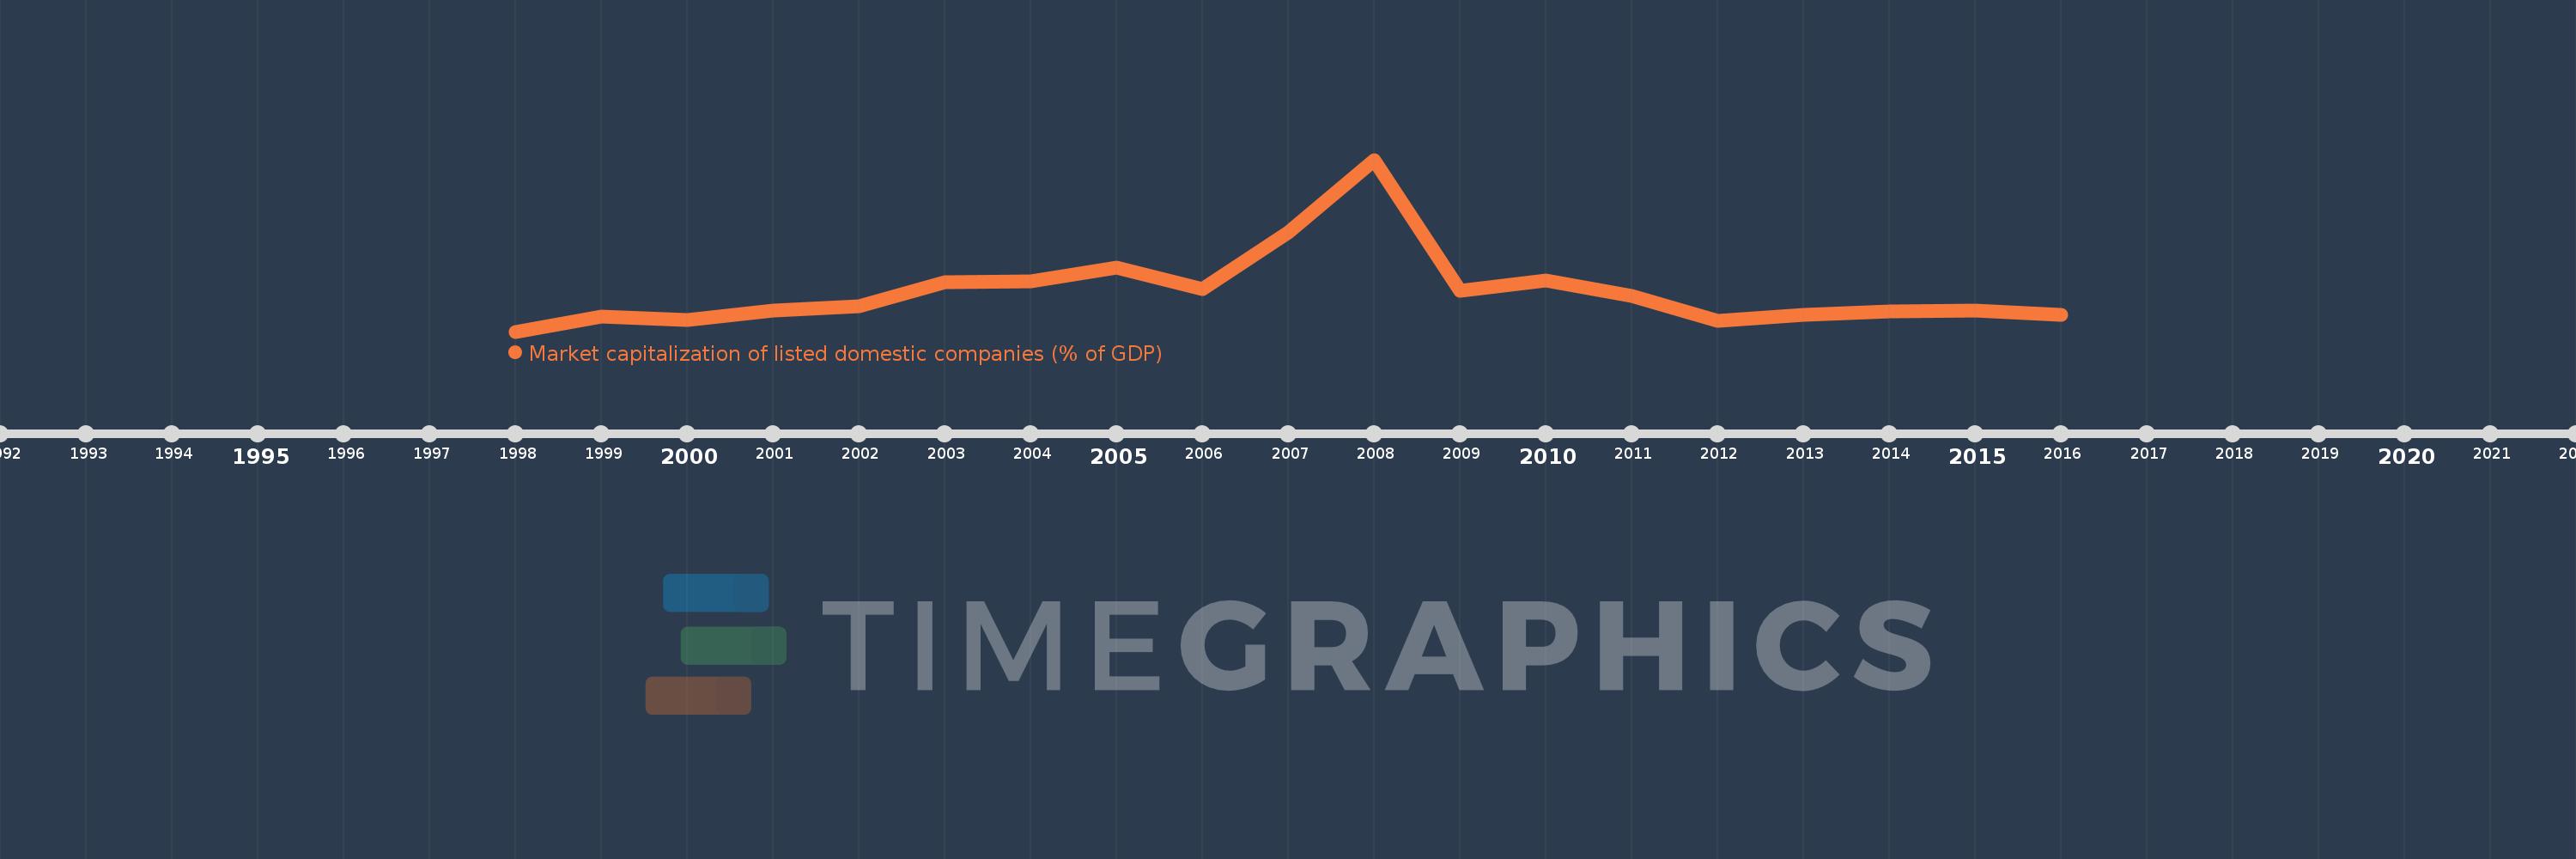
Market capitalization of listed domestic companies (% of GDP)
2016,2015,2014,2013,2012,2011,2010,2009,2008,2007,2006,2005,2004,2003,2002,2001,2000,1999,1998
Estas estadísticas en otros países:
línea de tiempo (timeline):
En esta escala de tiempo se presenta un gráfico de 1998 y 2016 de Slovenia. Los datos de 1997 están ausentes. El número de observaciones reales por fecha: 19.
Fuente (nombre):
Indicadores del desarrollo mundial
Fuente (organización):
World Federation of Exchanges database.
Categorías:
Financial Sector
Se ha actualizado:
23 abr 2017 año
Los indicadores de los cambios de valor en los últimos años
Mínimo:
9.039
1 ene 1998 año
Máximo:
59.981
1 ene 2008 año
A la fecha de observación
Valor
Cambio absoluto
El cambio con respecto al valor anterior
1 ene 1998 año
9.039
+9.039
0.0%
1 ene 1999 año
13.491
+4.452
49.25%
1 ene 2000 año
12.578
-0.913
-6.77%
1 ene 2001 año
15.238
+2.659
21.14%
1 ene 2002 año
16.581
+1.343
8.81%
1 ene 2003 año
23.672
+7.091
42.77%
1 ene 2004 año
24.023
+0.351
1.48%
1 ene 2005 año
28.073
+4.05
16.86%
1 ene 2006 año
21.732
-6.341
-22.59%
1 ene 2007 año
38.35
+16.618
76.47%
1 ene 2008 año
59.981
+21.632
56.41%
1 ene 2009 año
21.226
-38.756
-64.61%
1 ene 2010 año
24.164
+2.938
13.84%
1 ene 2011 año
19.636
-4.528
-18.74%
1 ene 2012 año
12.334
-7.302
-37.19%
1 ene 2013 año
13.997
+1.663
13.48%
1 ene 2014 año
14.948
+0.951
6.79%
1 ene 2015 año
15.181
+0.233
1.56%
1 ene 2016 año
14.109
-1.073
-7.07%
Ranking de los países por los datos estadísticos actuales


Comentarios: