30
/es/
AIzaSyAYiBZKx7MnpbEhh9jyipgxe19OcubqV5w
April 1, 2024
26709
Early-demographic dividend
EAR
false
2
1
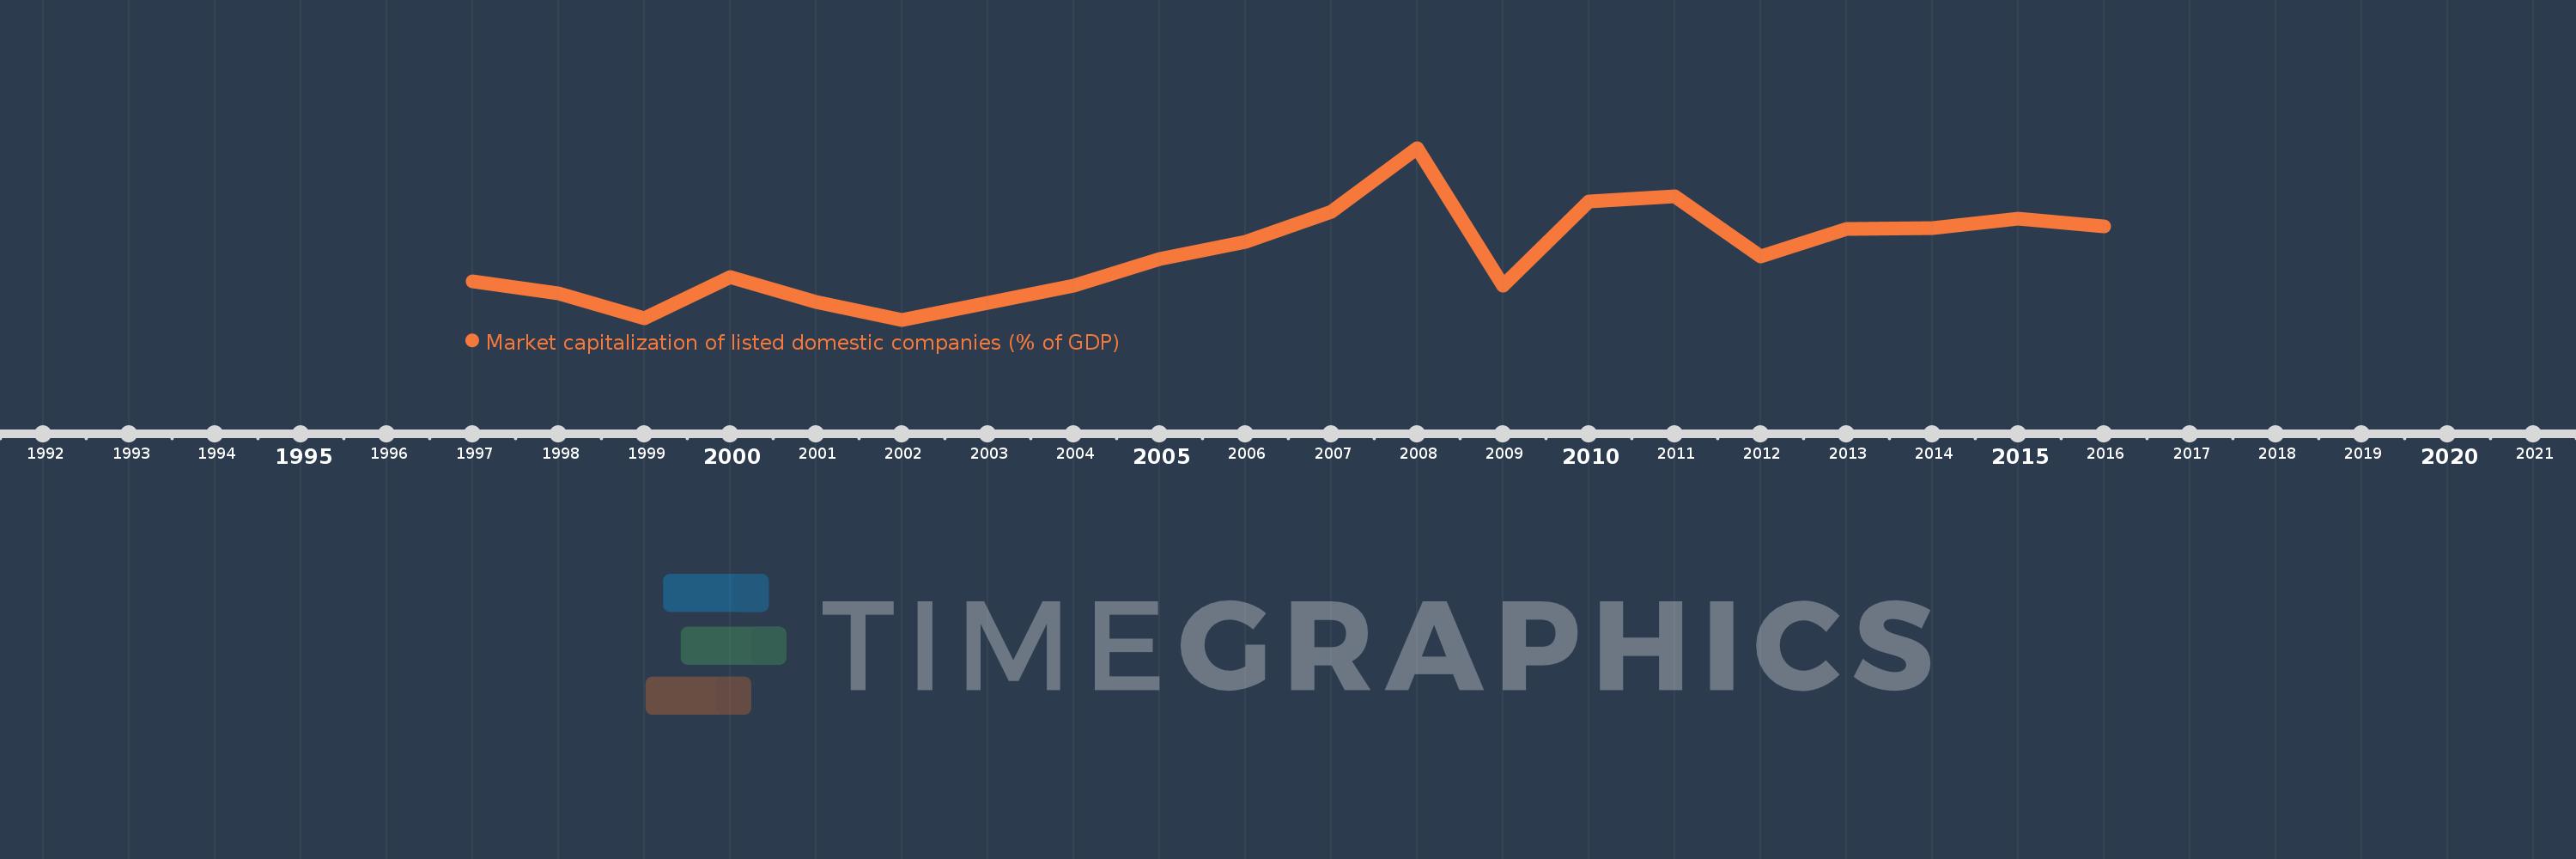
Market capitalization of listed domestic companies (% of GDP)
2016,2015,2014,2013,2012,2011,2010,2009,2008,2007,2006,2005,2004,2002,2001,2000,1999,1998,1997
