29
/es/
es
AIzaSyAYiBZKx7MnpbEhh9jyipgxe19OcubqV5w
April 1, 2024
218619
Panama
PAN
true
2
1
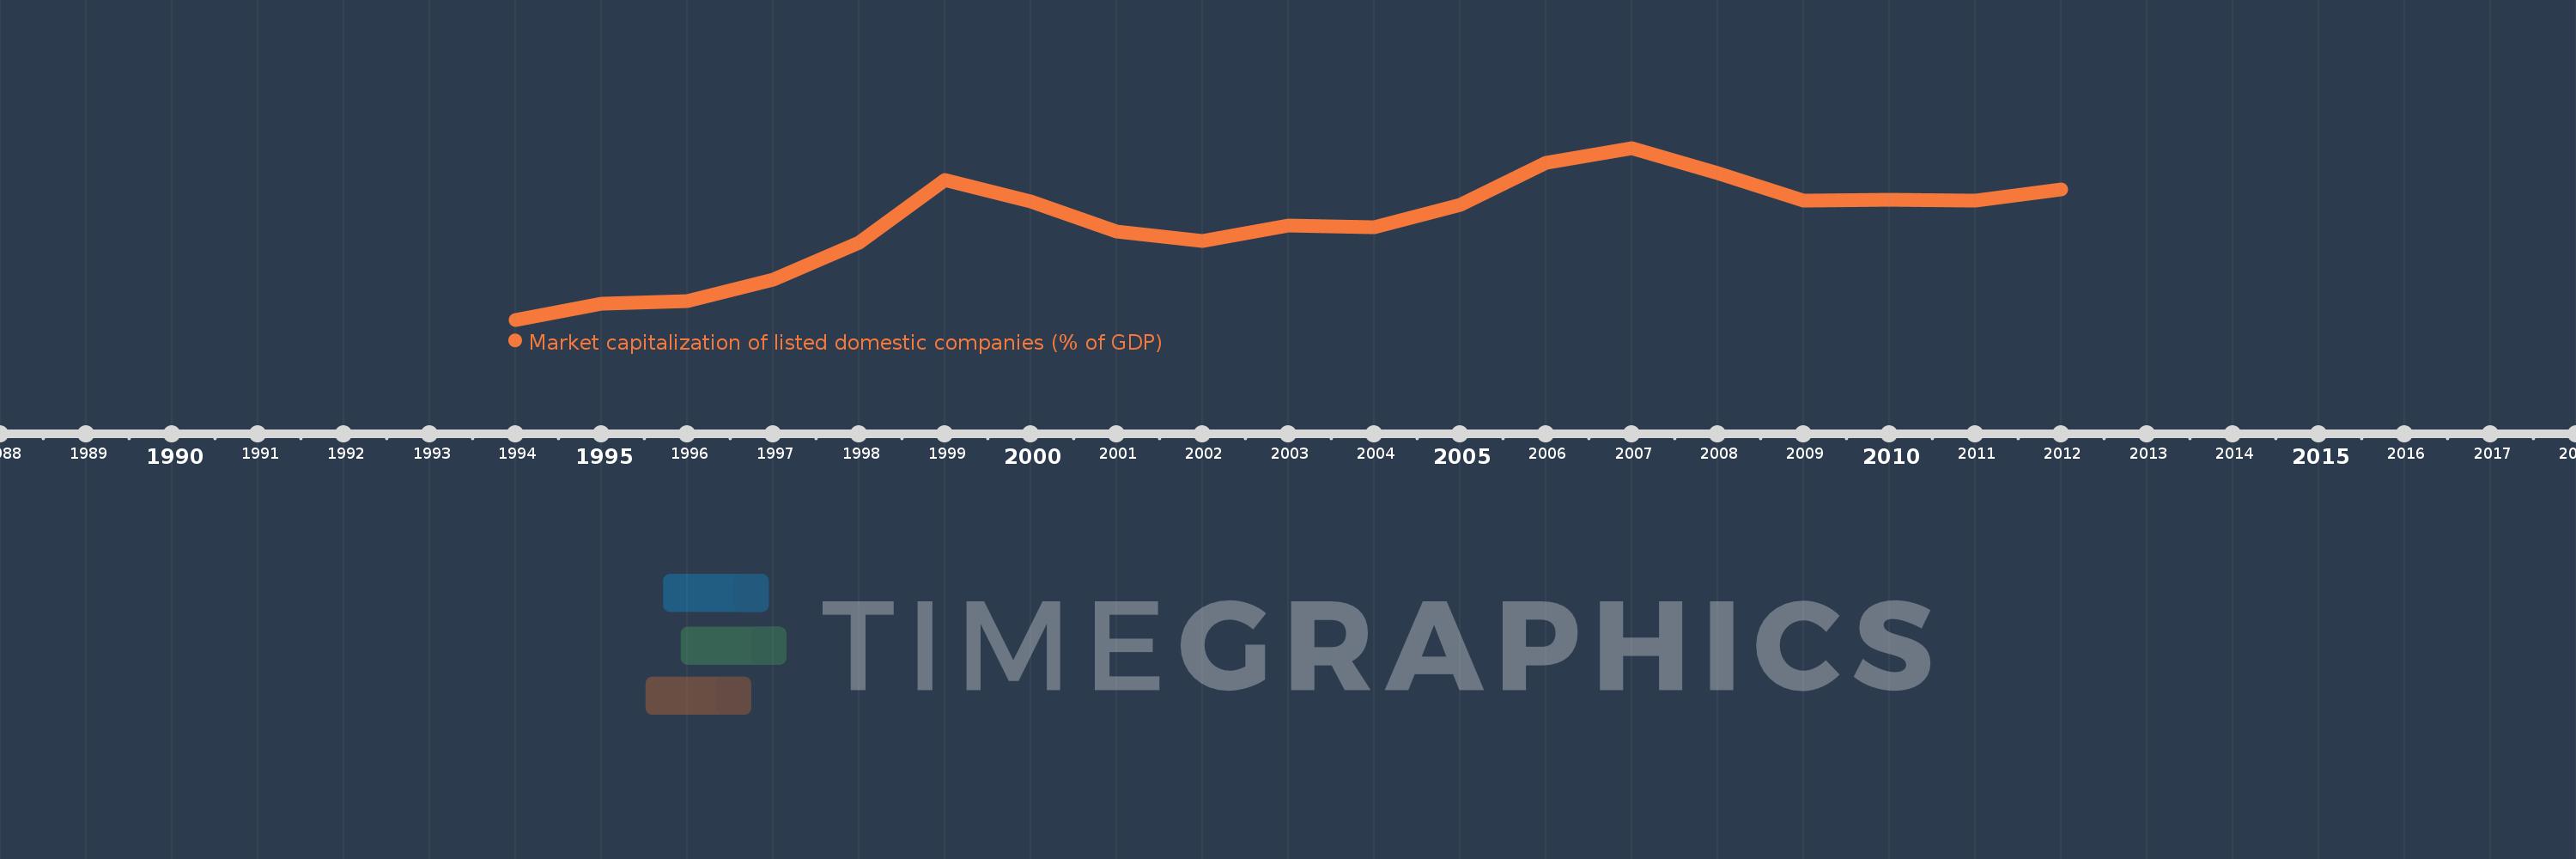
Market capitalization of listed domestic companies (% of GDP)
2012,2011,2010,2009,2008,2007,2006,2005,2004,2003,2002,2001,2000,1999,1998,1997,1996,1995,1994
Estas estadísticas en otros países:
línea de tiempo (timeline):
En esta escala de tiempo se presenta un gráfico de 1994 y 2012 de Panama. Los datos de 1993 están ausentes. El número de observaciones reales por fecha: 19.
Fuente (nombre):
Indicadores del desarrollo mundial
Fuente (organización):
World Federation of Exchanges database.
Categorías:
Financial Sector
Se ha actualizado:
23 abr 2017 año
Los indicadores de los cambios de valor en los últimos años
Mínimo:
4.964
1 ene 1994 año
Máximo:
39.42
1 ene 2007 año
A la fecha de observación
Valor
Cambio absoluto
El cambio con respecto al valor anterior
1 ene 1994 año
4.964
+4.964
0.0%
1 ene 1995 año
8.132
+3.168
63.81%
1 ene 1996 año
8.68
+0.548
6.74%
1 ene 1997 año
12.963
+4.283
49.34%
1 ene 1998 año
20.372
+7.409
57.15%
1 ene 1999 año
32.978
+12.607
61.88%
1 ene 2000 año
28.705
-4.273
-12.96%
1 ene 2001 año
22.708
-5.997
-20.89%
1 ene 2002 año
20.813
-1.894
-8.34%
1 ene 2003 año
23.814
+3.001
14.42%
1 ene 2004 año
23.514
-0.3
-1.26%
1 ene 2005 año
27.992
+4.478
19.05%
1 ene 2006 año
36.415
+8.423
30.09%
1 ene 2007 año
39.42
+3.004
8.25%
1 ene 2008 año
34.37
-5.05
-12.81%
1 ene 2009 año
28.811
-5.559
-16.17%
1 ene 2010 año
29.039
+0.228
0.79%
1 ene 2011 año
28.869
-0.17
-0.59%
1 ene 2012 año
31.075
+2.206
7.64%
Ranking de los países por los datos estadísticos actuales


Comentarios: