29
/es/
es
AIzaSyAYiBZKx7MnpbEhh9jyipgxe19OcubqV5w
April 1, 2024
27311
East Asia & Pacific
EAS
false
2
1
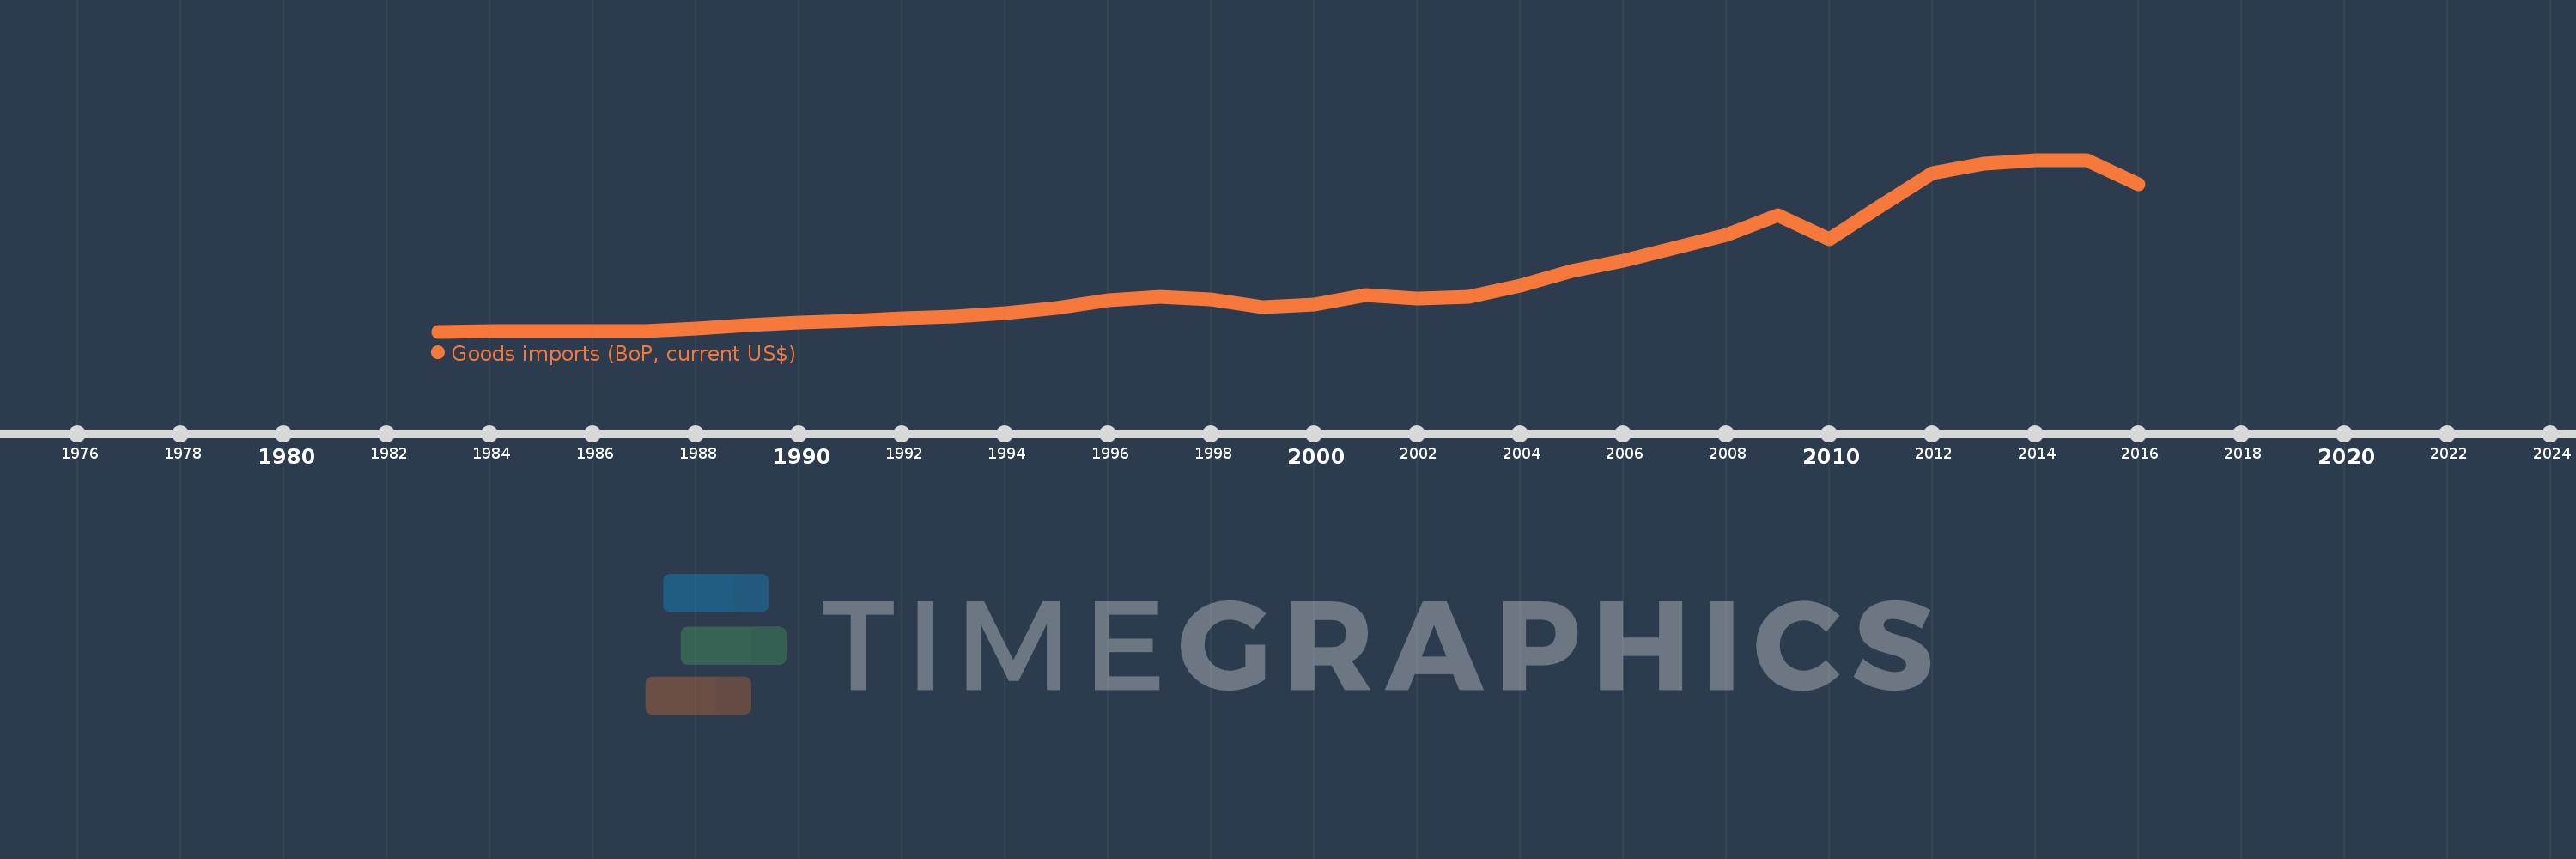
Goods imports (BoP, current US$)
2016,2015,2014,2013,2012,2011,2010,2009,2008,2007,2006,2005,2004,2003,2002,2001,2000,1999,1998,1997,1996,1995,1994,1993,1992,1991,1990,1989,1988,1987,1986,1985,1984,1983
Estas estadísticas en otros países:
AfghanistanAlbaniaAlgeriaAngolaAntigua and BarbudaArab WorldArgentinaArmeniaArubaAustraliaAustriaAzerbaijanBahamas, TheBahrainBangladeshBarbadosBelarusBelgiumBelizeBeninBermudaBhutanBoliviaBosnia and HerzegovinaBotswanaBrazilBrunei DarussalamBulgariaBurkina FasoBurundiCabo VerdeCambodiaCameroonCanadaCaribbean small statesCentral African RepublicCentral Europe and the BalticsChadChileChinaColombiaComorosCongo, Dem. Rep.Congo, Rep.Costa RicaCote d'IvoireCroatiaCuracaoCyprusCzech RepublicDenmarkDjiboutiDominicaDominican RepublicEarly-demographic dividendEast Asia & PacificEast Asia & Pacific (excluding high income)East Asia & Pacific (IDA & IBRD countries)EcuadorEgypt, Arab Rep.El SalvadorEquatorial GuineaEritreaEstoniaEthiopiaEuro areaEurope & Central AsiaEurope & Central Asia (excluding high income)Europe & Central Asia (IDA & IBRD countries)European UnionFaroe IslandsFijiFinlandFragile and conflict affected situationsFranceFrench PolynesiaGabonGambia, TheGeorgiaGermanyGhanaGreeceGrenadaGuatemalaGuineaGuinea-BissauGuyanaHaitiHeavily indebted poor countries (HIPC)High incomeHondurasHong Kong SAR, ChinaHungaryIBRD onlyIcelandIDA & IBRD totalIDA blendIDA onlyIDA totalIndiaIndonesiaIran, Islamic Rep.IraqIrelandIsraelItalyJamaicaJapanJordanKazakhstanKenyaKiribatiKorea, Rep.KosovoKuwaitKyrgyz RepublicLao PDRLate-demographic dividendLatin America & Caribbean Latin America & Caribbean (excluding high income)Latin America & the Caribbean (IDA & IBRD countries)LatviaLeast developed countries: UN classificationLebanonLesothoLiberiaLibyaLithuaniaLow & middle incomeLow incomeLower middle incomeLuxembourgMacao SAR, ChinaMacedonia, FYRMadagascarMalawiMalaysiaMaldivesMaliMaltaMarshall IslandsMauritaniaMauritiusMexicoMicronesia, Fed. Sts.Middle East & North Africa (excluding high income)Middle East & North Africa (IDA & IBRD countries)Middle incomeMoldovaMongoliaMontenegroMoroccoMozambiqueMyanmarNamibiaNepalNetherlandsNew CaledoniaNew ZealandNicaraguaNigerNigeriaNorth AmericaNorwayOECD membersOmanOther small statesPacific island small statesPakistanPalauPanamaPapua New GuineaParaguayPeruPhilippinesPolandPortugalPost-demographic dividendPre-demographic dividendQatarRomaniaRussian FederationRwandaSamoaSao Tome and PrincipeSaudi ArabiaSenegalSerbiaSeychellesSierra LeoneSingaporeSint Maarten (Dutch part)Slovak RepublicSloveniaSmall statesSolomon IslandsSouth AfricaSouth AsiaSouth Asia (IDA & IBRD)South SudanSpainSri LankaSt. Kitts and NevisSt. LuciaSt. Vincent and the GrenadinesSub-Saharan Africa Sub-Saharan Africa (excluding high income)Sub-Saharan Africa (IDA & IBRD countries)SudanSurinameSwazilandSwedenSwitzerlandSyrian Arab RepublicTajikistanTanzaniaThailandTimor-LesteTogoTongaTrinidad and TobagoTunisiaTurkeyTuvaluUgandaUkraineUnited KingdomUnited StatesUpper middle incomeUruguayVanuatuVenezuela, RBVietnamWest Bank and GazaWorldYemen, Rep.ZambiaZimbabwe línea de tiempo (timeline):
En esta escala de tiempo se presenta un gráfico de 1983 y 2016 de East Asia & Pacific. Los datos de 1982 están ausentes. El número de observaciones reales por fecha: 34.
Fuente (nombre):
Indicadores del desarrollo mundial
Fuente (organización):
International Monetary Fund, Balance of Payments Statistics Yearbook and data files.
Categorías:
Economy & Growth, Trade
Se ha actualizado:
23 abr 2017 año
Los indicadores de los cambios de valor en los últimos años
En promedio:
1.925 billones
Mínimo:
265.465 bn
1 ene 1983 año
Máximo:
5.465 billones
1 ene 2015 año
A la fecha de observación
Valor
Cambio absoluto
El cambio con respecto al valor anterior
1 ene 1983 año
265.465 bn
+265.465 bn
0.0%
1 ene 1984 año
274.564 bn
+9.099 bn
3.43%
1 ene 1985 año
277.625 bn
+3.061 bn
1.12%
1 ene 1986 año
283.283 bn
+5.658 bn
2.04%
1 ene 1987 año
289.766 bn
+6.482 bn
2.29%
1 ene 1988 año
356.829 bn
+67.063 bn
23.14%
1 ene 1989 año
463.069 bn
+106.24 bn
29.77%
1 ene 1990 año
528.854 bn
+65.785 bn
14.21%
1 ene 1991 año
582.481 bn
+53.627 bn
10.14%
1 ene 1992 año
660.011 bn
+77.53 bn
13.31%
1 ene 1993 año
731.134 bn
+71.123 bn
10.78%
1 ene 1994 año
832.471 bn
+101.336 bn
13.86%
1 ene 1995 año
978.012 bn
+145.542 bn
17.48%
1 ene 1996 año
1.217 billones
+239.128 bn
24.45%
1 ene 1997 año
1.317 billones
+99.517 bn
8.18%
1 ene 1998 año
1.243 billones
-73.764 bn
-5.6%
1 ene 1999 año
1.002 billones
-240.714 bn
-19.37%
1 ene 2000 año
1.092 billones
+89.862 bn
8.97%
1 ene 2001 año
1.373 billones
+281.123 bn
25.74%
1 ene 2002 año
1.256 billones
-117.261 bn
-8.54%
1 ene 2003 año
1.315 billones
+58.725 bn
4.68%
1 ene 2004 año
1.668 billones
+353.705 bn
26.91%
1 ene 2005 año
2.093 billones
+425.075 bn
25.48%
1 ene 2006 año
2.423 billones
+329.266 bn
15.73%
1 ene 2007 año
2.795 billones
+372.52 bn
15.38%
1 ene 2008 año
3.18 billones
+385.082 bn
13.78%
1 ene 2009 año
3.799 billones
+618.225 bn
19.44%
1 ene 2010 año
3.055 billones
-743.204 bn
-19.57%
1 ene 2011 año
4.067 billones
+1.011 billones
33.1%
1 ene 2012 año
5.056 billones
+989.923 bn
24.34%
1 ene 2013 año
5.356 billones
+299.223 bn
5.92%
1 ene 2014 año
5.45 billones
+94.596 bn
1.77%
1 ene 2015 año
5.465 billones
+14.364 bn
0.26%
1 ene 2016 año
4.719 billones
-745.484 bn
-13.64%
Ranking de los países por los datos estadísticos actuales


Comentarios: