29
/es/
es
AIzaSyAYiBZKx7MnpbEhh9jyipgxe19OcubqV5w
April 1, 2024
247581
Spain
ESP
true
2
1
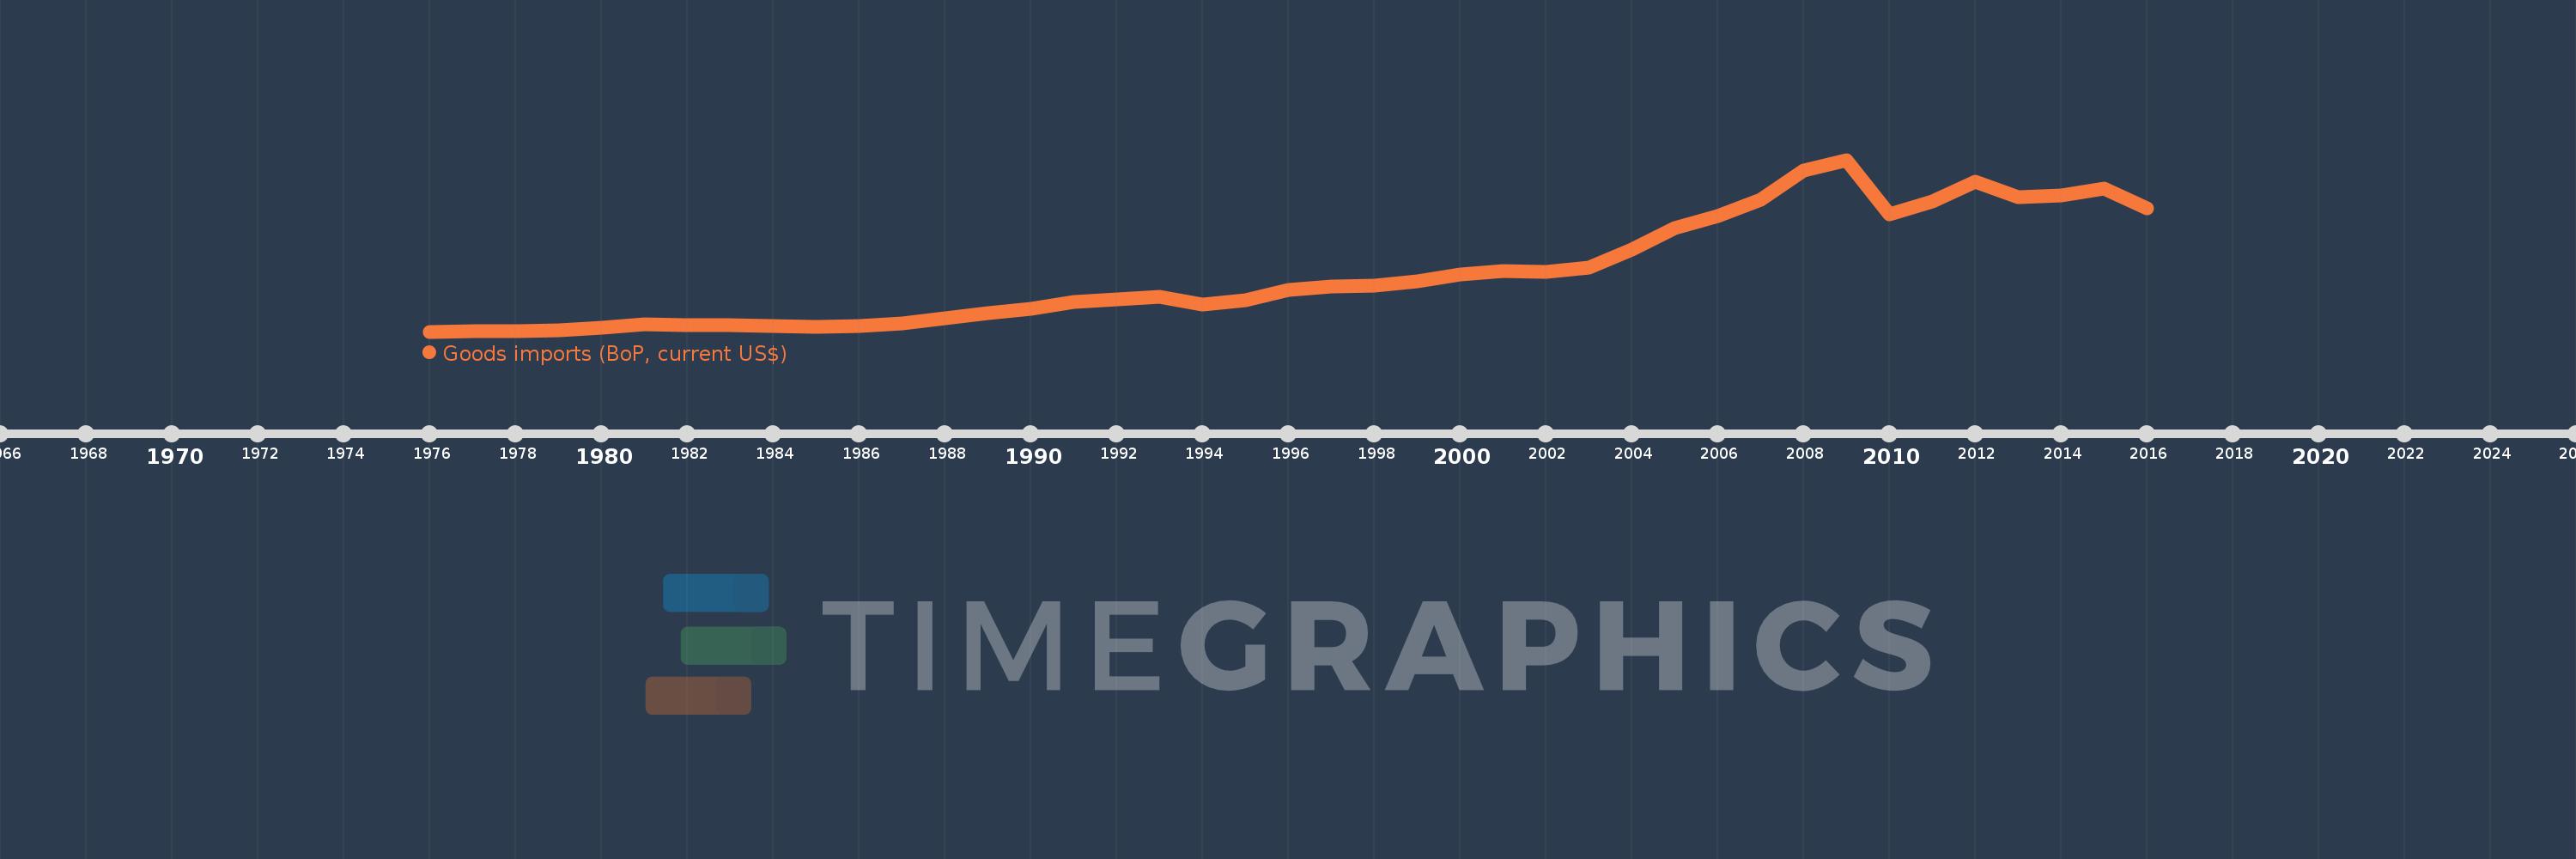
Goods imports (BoP, current US$)
2016,2015,2014,2013,2012,2011,2010,2009,2008,2007,2006,2005,2004,2003,2002,2001,2000,1999,1998,1997,1996,1995,1994,1993,1992,1991,1990,1989,1988,1987,1986,1985,1984,1983,1982,1981,1980,1979,1978,1977,1976
Estas estadísticas en otros países:
AfghanistanAlbaniaAlgeriaAngolaAntigua and BarbudaArab WorldArgentinaArmeniaArubaAustraliaAustriaAzerbaijanBahamas, TheBahrainBangladeshBarbadosBelarusBelgiumBelizeBeninBermudaBhutanBoliviaBosnia and HerzegovinaBotswanaBrazilBrunei DarussalamBulgariaBurkina FasoBurundiCabo VerdeCambodiaCameroonCanadaCaribbean small statesCentral African RepublicCentral Europe and the BalticsChadChileChinaColombiaComorosCongo, Dem. Rep.Congo, Rep.Costa RicaCote d'IvoireCroatiaCuracaoCyprusCzech RepublicDenmarkDjiboutiDominicaDominican RepublicEarly-demographic dividendEast Asia & PacificEast Asia & Pacific (excluding high income)East Asia & Pacific (IDA & IBRD countries)EcuadorEgypt, Arab Rep.El SalvadorEquatorial GuineaEritreaEstoniaEthiopiaEuro areaEurope & Central AsiaEurope & Central Asia (excluding high income)Europe & Central Asia (IDA & IBRD countries)European UnionFaroe IslandsFijiFinlandFragile and conflict affected situationsFranceFrench PolynesiaGabonGambia, TheGeorgiaGermanyGhanaGreeceGrenadaGuatemalaGuineaGuinea-BissauGuyanaHaitiHeavily indebted poor countries (HIPC)High incomeHondurasHong Kong SAR, ChinaHungaryIBRD onlyIcelandIDA & IBRD totalIDA blendIDA onlyIDA totalIndiaIndonesiaIran, Islamic Rep.IraqIrelandIsraelItalyJamaicaJapanJordanKazakhstanKenyaKiribatiKorea, Rep.KosovoKuwaitKyrgyz RepublicLao PDRLate-demographic dividendLatin America & Caribbean Latin America & Caribbean (excluding high income)Latin America & the Caribbean (IDA & IBRD countries)LatviaLeast developed countries: UN classificationLebanonLesothoLiberiaLibyaLithuaniaLow & middle incomeLow incomeLower middle incomeLuxembourgMacao SAR, ChinaMacedonia, FYRMadagascarMalawiMalaysiaMaldivesMaliMaltaMarshall IslandsMauritaniaMauritiusMexicoMicronesia, Fed. Sts.Middle East & North Africa (excluding high income)Middle East & North Africa (IDA & IBRD countries)Middle incomeMoldovaMongoliaMontenegroMoroccoMozambiqueMyanmarNamibiaNepalNetherlandsNew CaledoniaNew ZealandNicaraguaNigerNigeriaNorth AmericaNorwayOECD membersOmanOther small statesPacific island small statesPakistanPalauPanamaPapua New GuineaParaguayPeruPhilippinesPolandPortugalPost-demographic dividendPre-demographic dividendQatarRomaniaRussian FederationRwandaSamoaSao Tome and PrincipeSaudi ArabiaSenegalSerbiaSeychellesSierra LeoneSingaporeSint Maarten (Dutch part)Slovak RepublicSloveniaSmall statesSolomon IslandsSouth AfricaSouth AsiaSouth Asia (IDA & IBRD)South SudanSpainSri LankaSt. Kitts and NevisSt. LuciaSt. Vincent and the GrenadinesSub-Saharan Africa Sub-Saharan Africa (excluding high income)Sub-Saharan Africa (IDA & IBRD countries)SudanSurinameSwazilandSwedenSwitzerlandSyrian Arab RepublicTajikistanTanzaniaThailandTimor-LesteTogoTongaTrinidad and TobagoTunisiaTurkeyTuvaluUgandaUkraineUnited KingdomUnited StatesUpper middle incomeUruguayVanuatuVenezuela, RBVietnamWest Bank and GazaWorldYemen, Rep.ZambiaZimbabwe línea de tiempo (timeline):
En esta escala de tiempo se presenta un gráfico de 1976 y 2016 de Spain. Los datos de 1975 están ausentes. El número de observaciones reales por fecha: 41.
Fuente (nombre):
Indicadores del desarrollo mundial
Fuente (organización):
International Monetary Fund, Balance of Payments Statistics Yearbook and data files.
Categorías:
Economy & Growth, Trade
Se ha actualizado:
23 abr 2017 año
Los indicadores de los cambios de valor en los últimos años
Mínimo:
15.207 bn
1 ene 1976 año
Máximo:
413.147 bn
1 ene 2009 año
A la fecha de observación
Valor
Cambio absoluto
El cambio con respecto al valor anterior
1 ene 1976 año
15.207 bn
+15.207 bn
0.0%
1 ene 1977 año
16.299 bn
+1.093 bn
7.18%
1 ene 1978 año
16.736 bn
+436.94 millones
2.68%
1 ene 1979 año
17.555 bn
+819.092 millones
4.89%
1 ene 1980 año
24.041 bn
+6.485 bn
36.94%
1 ene 1981 año
32.272 bn
+8.231 bn
34.24%
1 ene 1982 año
31.086 bn
-1.186 bn
-3.67%
1 ene 1983 año
30.542 bn
-544.284 millones
-1.75%
1 ene 1984 año
27.56 bn
-2.982 bn
-9.76%
1 ene 1985 año
26.985 bn
-575.011 millones
-2.09%
1 ene 1986 año
27.836 bn
+850.971 millones
3.15%
1 ene 1987 año
33.278 bn
+5.442 bn
19.55%
1 ene 1988 año
46.547 bn
+13.269 bn
39.87%
1 ene 1989 año
57.65 bn
+11.103 bn
23.85%
1 ene 1990 año
67.797 bn
+10.147 bn
17.6%
1 ene 1991 año
84.815 bn
+17.018 bn
25.1%
1 ene 1992 año
90.501 bn
+5.686 bn
6.7%
1 ene 1993 año
96.247 bn
+5.745 bn
6.35%
1 ene 1994 año
77.02 bn
-19.227 bn
-19.98%
1 ene 1995 año
88.817 bn
+11.797 bn
15.32%
1 ene 1996 año
112.107 bn
+23.29 bn
26.22%
1 ene 1997 año
118.909 bn
+6.801 bn
6.07%
1 ene 1998 año
121.414 bn
+2.506 bn
2.11%
1 ene 1999 año
132.569 bn
+11.155 bn
9.19%
1 ene 2000 año
147.377 bn
+14.808 bn
11.17%
1 ene 2001 año
155.399 bn
+8.022 bn
5.44%
1 ene 2002 año
154.432 bn
-967.387 millones
-0.62%
1 ene 2003 año
163.765 bn
+9.333 bn
6.04%
1 ene 2004 año
205.383 bn
+41.618 bn
25.41%
1 ene 2005 año
255.177 bn
+49.794 bn
24.24%
1 ene 2006 año
281.856 bn
+26.679 bn
10.46%
1 ene 2007 año
320.159 bn
+38.303 bn
13.59%
1 ene 2008 año
389.207 bn
+69.047 bn
21.57%
1 ene 2009 año
413.147 bn
+23.94 bn
6.15%
1 ene 2010 año
286.585 bn
-126.561 bn
-30.63%
1 ene 2011 año
316.344 bn
+29.758 bn
10.38%
1 ene 2012 año
362.213 bn
+45.869 bn
14.5%
1 ene 2013 año
325.844 bn
-36.369 bn
-10.04%
1 ene 2014 año
331.461 bn
+5.617 bn
1.72%
1 ene 2015 año
346.57 bn
+15.109 bn
4.56%
1 ene 2016 año
301.54 bn
-45.03 bn
-12.99%
Ranking de los países por los datos estadísticos actuales


Comentarios: