29
/es/
es
AIzaSyAYiBZKx7MnpbEhh9jyipgxe19OcubqV5w
April 1, 2024
24915
Caribbean small states
CSS
false
2
1
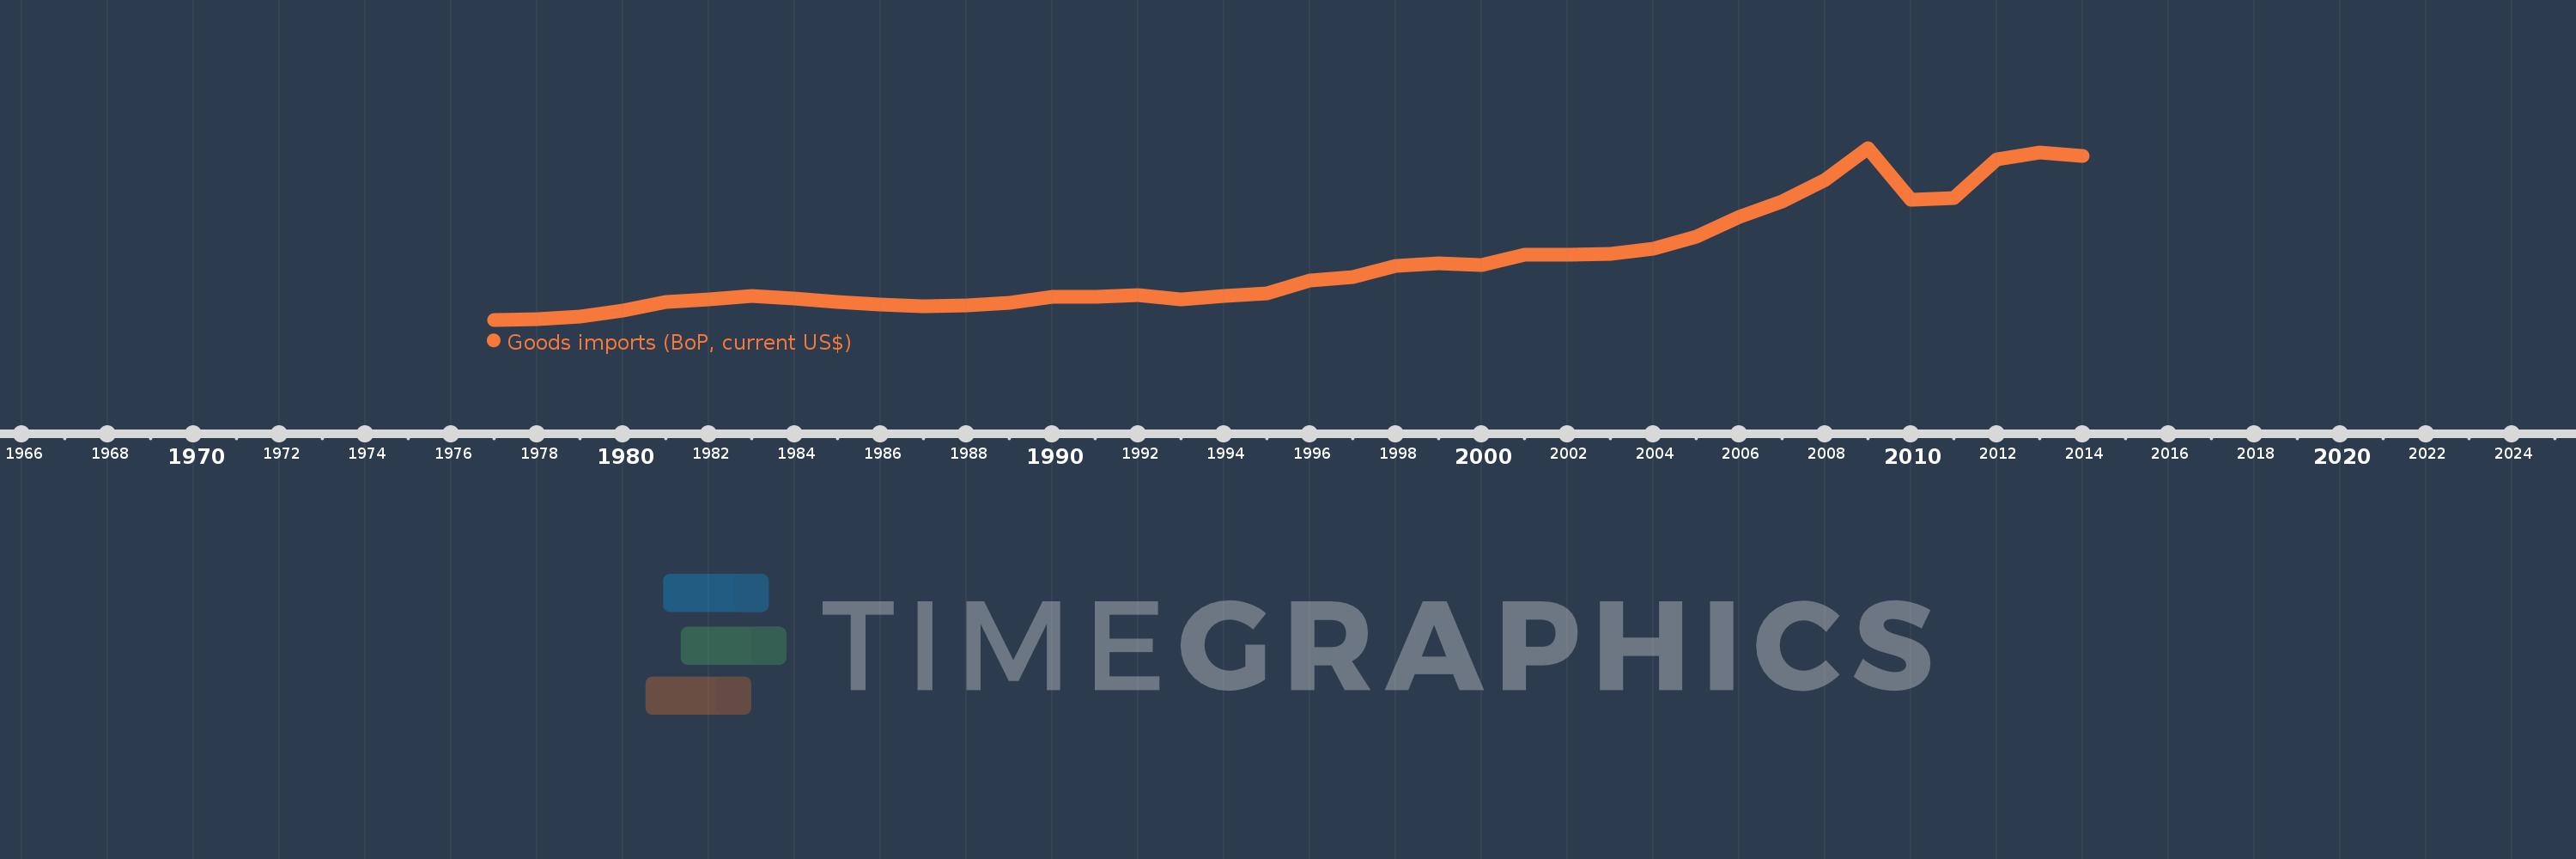
Goods imports (BoP, current US$)
2014,2013,2012,2011,2010,2009,2008,2007,2006,2005,2004,2003,2002,2001,2000,1999,1998,1997,1996,1995,1994,1993,1992,1991,1990,1989,1988,1987,1986,1985,1984,1983,1982,1981,1980,1979,1978,1977
Estas estadísticas en otros países:
AfghanistanAlbaniaAlgeriaAngolaAntigua and BarbudaArab WorldArgentinaArmeniaArubaAustraliaAustriaAzerbaijanBahamas, TheBahrainBangladeshBarbadosBelarusBelgiumBelizeBeninBermudaBhutanBoliviaBosnia and HerzegovinaBotswanaBrazilBrunei DarussalamBulgariaBurkina FasoBurundiCabo VerdeCambodiaCameroonCanadaCaribbean small statesCentral African RepublicCentral Europe and the BalticsChadChileChinaColombiaComorosCongo, Dem. Rep.Congo, Rep.Costa RicaCote d'IvoireCroatiaCuracaoCyprusCzech RepublicDenmarkDjiboutiDominicaDominican RepublicEarly-demographic dividendEast Asia & PacificEast Asia & Pacific (excluding high income)East Asia & Pacific (IDA & IBRD countries)EcuadorEgypt, Arab Rep.El SalvadorEquatorial GuineaEritreaEstoniaEthiopiaEuro areaEurope & Central AsiaEurope & Central Asia (excluding high income)Europe & Central Asia (IDA & IBRD countries)European UnionFaroe IslandsFijiFinlandFragile and conflict affected situationsFranceFrench PolynesiaGabonGambia, TheGeorgiaGermanyGhanaGreeceGrenadaGuatemalaGuineaGuinea-BissauGuyanaHaitiHeavily indebted poor countries (HIPC)High incomeHondurasHong Kong SAR, ChinaHungaryIBRD onlyIcelandIDA & IBRD totalIDA blendIDA onlyIDA totalIndiaIndonesiaIran, Islamic Rep.IraqIrelandIsraelItalyJamaicaJapanJordanKazakhstanKenyaKiribatiKorea, Rep.KosovoKuwaitKyrgyz RepublicLao PDRLate-demographic dividendLatin America & Caribbean Latin America & Caribbean (excluding high income)Latin America & the Caribbean (IDA & IBRD countries)LatviaLeast developed countries: UN classificationLebanonLesothoLiberiaLibyaLithuaniaLow & middle incomeLow incomeLower middle incomeLuxembourgMacao SAR, ChinaMacedonia, FYRMadagascarMalawiMalaysiaMaldivesMaliMaltaMarshall IslandsMauritaniaMauritiusMexicoMicronesia, Fed. Sts.Middle East & North Africa (excluding high income)Middle East & North Africa (IDA & IBRD countries)Middle incomeMoldovaMongoliaMontenegroMoroccoMozambiqueMyanmarNamibiaNepalNetherlandsNew CaledoniaNew ZealandNicaraguaNigerNigeriaNorth AmericaNorwayOECD membersOmanOther small statesPacific island small statesPakistanPalauPanamaPapua New GuineaParaguayPeruPhilippinesPolandPortugalPost-demographic dividendPre-demographic dividendQatarRomaniaRussian FederationRwandaSamoaSao Tome and PrincipeSaudi ArabiaSenegalSerbiaSeychellesSierra LeoneSingaporeSint Maarten (Dutch part)Slovak RepublicSloveniaSmall statesSolomon IslandsSouth AfricaSouth AsiaSouth Asia (IDA & IBRD)South SudanSpainSri LankaSt. Kitts and NevisSt. LuciaSt. Vincent and the GrenadinesSub-Saharan Africa Sub-Saharan Africa (excluding high income)Sub-Saharan Africa (IDA & IBRD countries)SudanSurinameSwazilandSwedenSwitzerlandSyrian Arab RepublicTajikistanTanzaniaThailandTimor-LesteTogoTongaTrinidad and TobagoTunisiaTurkeyTuvaluUgandaUkraineUnited KingdomUnited StatesUpper middle incomeUruguayVanuatuVenezuela, RBVietnamWest Bank and GazaWorldYemen, Rep.ZambiaZimbabwe línea de tiempo (timeline):
En esta escala de tiempo se presenta un gráfico de 1977 y 2014 de Caribbean small states. Los datos de 1976 están ausentes. El número de observaciones reales por fecha: 38.
Fuente (nombre):
Indicadores del desarrollo mundial
Fuente (organización):
International Monetary Fund, Balance of Payments Statistics Yearbook and data files.
Categorías:
Economy & Growth, Trade
Se ha actualizado:
23 abr 2017 año
Los indicadores de los cambios de valor en los últimos años
Mínimo:
2.987 bn
1 ene 1977 año
Máximo:
28.098 bn
1 ene 2009 año
A la fecha de observación
Valor
Cambio absoluto
El cambio con respecto al valor anterior
1 ene 1977 año
2.987 bn
+2.987 bn
0.0%
1 ene 1978 año
3.016 bn
+29.834 millones
1.0%
1 ene 1979 año
3.472 bn
+455.823 millones
15.11%
1 ene 1980 año
4.316 bn
+844.167 millones
24.31%
1 ene 1981 año
5.589 bn
+1.273 bn
29.49%
1 ene 1982 año
5.943 bn
+354.235 millones
6.34%
1 ene 1983 año
6.424 bn
+480.178 millones
8.08%
1 ene 1984 año
6.126 bn
-297.109 millones
-4.63%
1 ene 1985 año
5.571 bn
-555.588 millones
-9.07%
1 ene 1986 año
5.218 bn
-352.655 millones
-6.33%
1 ene 1987 año
4.927 bn
-291.131 millones
-5.58%
1 ene 1988 año
5.12 bn
+192.984 millones
3.92%
1 ene 1989 año
5.51 bn
+390.134 millones
7.62%
1 ene 1990 año
6.36 bn
+850.24 millones
15.43%
1 ene 1991 año
6.322 bn
-38.232 millones
-0.6%
1 ene 1992 año
6.555 bn
+232.889 millones
3.68%
1 ene 1993 año
6.002 bn
-553.466 millones
-8.44%
1 ene 1994 año
6.424 bn
+422.002 millones
7.03%
1 ene 1995 año
6.853 bn
+429.877 millones
6.69%
1 ene 1996 año
8.705 bn
+1.851 bn
27.01%
1 ene 1997 año
9.206 bn
+501.123 millones
5.76%
1 ene 1998 año
10.861 bn
+1.656 bn
17.98%
1 ene 1999 año
11.199 bn
+337.876 millones
3.11%
1 ene 2000 año
10.974 bn
-225.291 millones
-2.01%
1 ene 2001 año
12.488 bn
+1.514 bn
13.8%
1 ene 2002 año
12.457 bn
-31.12 millones
-0.25%
1 ene 2003 año
12.585 bn
+127.813 millones
1.03%
1 ene 2004 año
13.37 bn
+784.774 millones
6.24%
1 ene 2005 año
15.108 bn
+1.738 bn
13.0%
1 ene 2006 año
18.016 bn
+2.907 bn
19.24%
1 ene 2007 año
20.229 bn
+2.213 bn
12.29%
1 ene 2008 año
23.407 bn
+3.178 bn
15.71%
1 ene 2009 año
28.098 bn
+4.691 bn
20.04%
1 ene 2010 año
20.488 bn
-7.61 bn
-27.08%
1 ene 2011 año
20.743 bn
+254.674 millones
1.24%
1 ene 2012 año
26.368 bn
+5.625 bn
27.12%
1 ene 2013 año
27.474 bn
+1.106 bn
4.2%
1 ene 2014 año
26.956 bn
-518.364 millones
-1.89%
Ranking de los países por los datos estadísticos actuales


Comentarios: