29
/es/
es
AIzaSyAYiBZKx7MnpbEhh9jyipgxe19OcubqV5w
April 1, 2024
156023
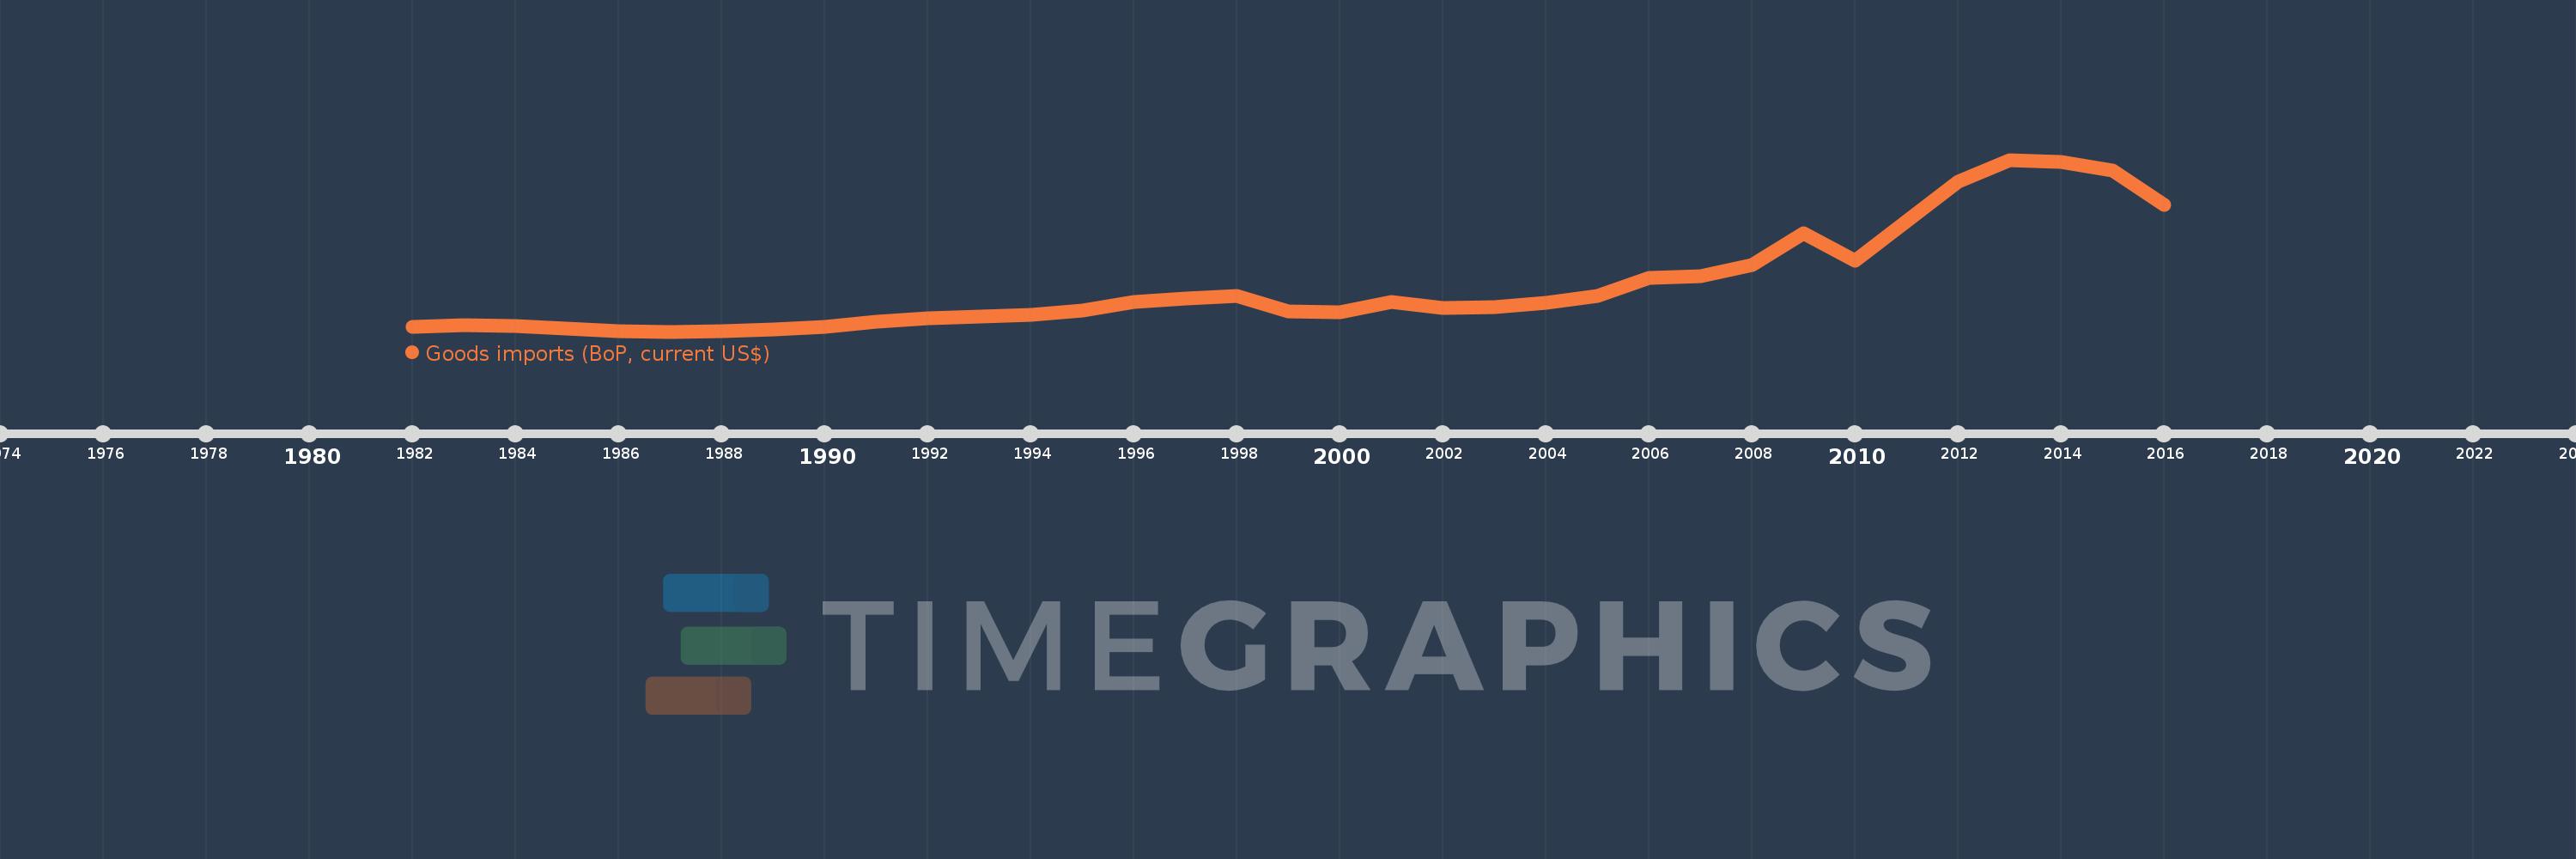
Indonesia
IDN
true
2
1
Goods imports (BoP, current US$)
2016,2015,2014,2013,2012,2011,2010,2009,2008,2007,2006,2005,2004,2003,2002,2001,2000,1999,1998,1997,1996,1995,1994,1993,1992,1991,1990,1989,1988,1987,1986,1985,1984,1983,1982
Estas estadísticas en otros países:
AfghanistanAlbaniaAlgeriaAngolaAntigua and BarbudaArab WorldArgentinaArmeniaArubaAustraliaAustriaAzerbaijanBahamas, TheBahrainBangladeshBarbadosBelarusBelgiumBelizeBeninBermudaBhutanBoliviaBosnia and HerzegovinaBotswanaBrazilBrunei DarussalamBulgariaBurkina FasoBurundiCabo VerdeCambodiaCameroonCanadaCaribbean small statesCentral African RepublicCentral Europe and the BalticsChadChileChinaColombiaComorosCongo, Dem. Rep.Congo, Rep.Costa RicaCote d'IvoireCroatiaCuracaoCyprusCzech RepublicDenmarkDjiboutiDominicaDominican RepublicEarly-demographic dividendEast Asia & PacificEast Asia & Pacific (excluding high income)East Asia & Pacific (IDA & IBRD countries)EcuadorEgypt, Arab Rep.El SalvadorEquatorial GuineaEritreaEstoniaEthiopiaEuro areaEurope & Central AsiaEurope & Central Asia (excluding high income)Europe & Central Asia (IDA & IBRD countries)European UnionFaroe IslandsFijiFinlandFragile and conflict affected situationsFranceFrench PolynesiaGabonGambia, TheGeorgiaGermanyGhanaGreeceGrenadaGuatemalaGuineaGuinea-BissauGuyanaHaitiHeavily indebted poor countries (HIPC)High incomeHondurasHong Kong SAR, ChinaHungaryIBRD onlyIcelandIDA & IBRD totalIDA blendIDA onlyIDA totalIndiaIndonesiaIran, Islamic Rep.IraqIrelandIsraelItalyJamaicaJapanJordanKazakhstanKenyaKiribatiKorea, Rep.KosovoKuwaitKyrgyz RepublicLao PDRLate-demographic dividendLatin America & Caribbean Latin America & Caribbean (excluding high income)Latin America & the Caribbean (IDA & IBRD countries)LatviaLeast developed countries: UN classificationLebanonLesothoLiberiaLibyaLithuaniaLow & middle incomeLow incomeLower middle incomeLuxembourgMacao SAR, ChinaMacedonia, FYRMadagascarMalawiMalaysiaMaldivesMaliMaltaMarshall IslandsMauritaniaMauritiusMexicoMicronesia, Fed. Sts.Middle East & North Africa (excluding high income)Middle East & North Africa (IDA & IBRD countries)Middle incomeMoldovaMongoliaMontenegroMoroccoMozambiqueMyanmarNamibiaNepalNetherlandsNew CaledoniaNew ZealandNicaraguaNigerNigeriaNorth AmericaNorwayOECD membersOmanOther small statesPacific island small statesPakistanPalauPanamaPapua New GuineaParaguayPeruPhilippinesPolandPortugalPost-demographic dividendPre-demographic dividendQatarRomaniaRussian FederationRwandaSamoaSao Tome and PrincipeSaudi ArabiaSenegalSerbiaSeychellesSierra LeoneSingaporeSint Maarten (Dutch part)Slovak RepublicSloveniaSmall statesSolomon IslandsSouth AfricaSouth AsiaSouth Asia (IDA & IBRD)South SudanSpainSri LankaSt. Kitts and NevisSt. LuciaSt. Vincent and the GrenadinesSub-Saharan Africa Sub-Saharan Africa (excluding high income)Sub-Saharan Africa (IDA & IBRD countries)SudanSurinameSwazilandSwedenSwitzerlandSyrian Arab RepublicTajikistanTanzaniaThailandTimor-LesteTogoTongaTrinidad and TobagoTunisiaTurkeyTuvaluUgandaUkraineUnited KingdomUnited StatesUpper middle incomeUruguayVanuatuVenezuela, RBVietnamWest Bank and GazaWorldYemen, Rep.ZambiaZimbabwe línea de tiempo (timeline):
En esta escala de tiempo se presenta un gráfico de 1982 y 2016 de Indonesia. Los datos de 1981 están ausentes. El número de observaciones reales por fecha: 35.
Fuente (nombre):
Indicadores del desarrollo mundial
Fuente (organización):
International Monetary Fund, Balance of Payments Statistics Yearbook and data files.
Categorías:
Economy & Growth, Trade
Se ha actualizado:
23 abr 2017 año
Los indicadores de los cambios de valor en los últimos años
Mínimo:
11.938 bn
1 ene 1987 año
Máximo:
178.667 bn
1 ene 2013 año
A la fecha de observación
Valor
Cambio absoluto
El cambio con respecto al valor anterior
1 ene 1982 año
16.542 bn
+16.542 bn
0.0%
1 ene 1983 año
17.854 bn
+1.312 bn
7.93%
1 ene 1984 año
17.726 bn
-128.0 millones
-0.72%
1 ene 1985 año
15.047 bn
-2.679 bn
-15.11%
1 ene 1986 año
12.705 bn
-2.342 bn
-15.56%
1 ene 1987 año
11.938 bn
-767.0 millones
-6.04%
1 ene 1988 año
12.532 bn
+594.0 millones
4.98%
1 ene 1989 año
13.831 bn
+1.299 bn
10.37%
1 ene 1990 año
16.31 bn
+2.479 bn
17.92%
1 ene 1991 año
21.455 bn
+5.145 bn
31.55%
1 ene 1992 año
24.834 bn
+3.379 bn
15.75%
1 ene 1993 año
26.774 bn
+1.94 bn
7.81%
1 ene 1994 año
28.376 bn
+1.602 bn
5.98%
1 ene 1995 año
32.322 bn
+3.946 bn
13.91%
1 ene 1996 año
40.921 bn
+8.599 bn
26.6%
1 ene 1997 año
44.24 bn
+3.319 bn
8.11%
1 ene 1998 año
46.223 bn
+1.983 bn
4.48%
1 ene 1999 año
31.942 bn
-14.281 bn
-30.9%
1 ene 2000 año
30.598 bn
-1.344 bn
-4.21%
1 ene 2001 año
40.365 bn
+9.767 bn
31.92%
1 ene 2002 año
34.668 bn
-5.697 bn
-14.11%
1 ene 2003 año
35.652 bn
+983.39 millones
2.84%
1 ene 2004 año
39.546 bn
+3.894 bn
10.92%
1 ene 2005 año
46.616 bn
+7.07 bn
17.88%
1 ene 2006 año
64.071 bn
+17.456 bn
37.45%
1 ene 2007 año
66.053 bn
+1.982 bn
3.09%
1 ene 2008 año
76.775 bn
+10.722 bn
16.23%
1 ene 2009 año
107.667 bn
+30.892 bn
40.24%
1 ene 2010 año
80.979 bn
-26.688 bn
-24.79%
1 ene 2011 año
118.963 bn
+37.984 bn
46.91%
1 ene 2012 año
157.284 bn
+38.321 bn
32.21%
1 ene 2013 año
178.667 bn
+21.383 bn
13.6%
1 ene 2014 año
176.256 bn
-2.411 bn
-1.35%
1 ene 2015 año
168.31 bn
-7.946 bn
-4.51%
1 ene 2016 año
135.076 bn
-33.234 bn
-19.75%
Ranking de los países por los datos estadísticos actuales


Comentarios: