29
/es/
es
AIzaSyAYiBZKx7MnpbEhh9jyipgxe19OcubqV5w
April 1, 2024
26348
Early-demographic dividend
EAR
false
2
1
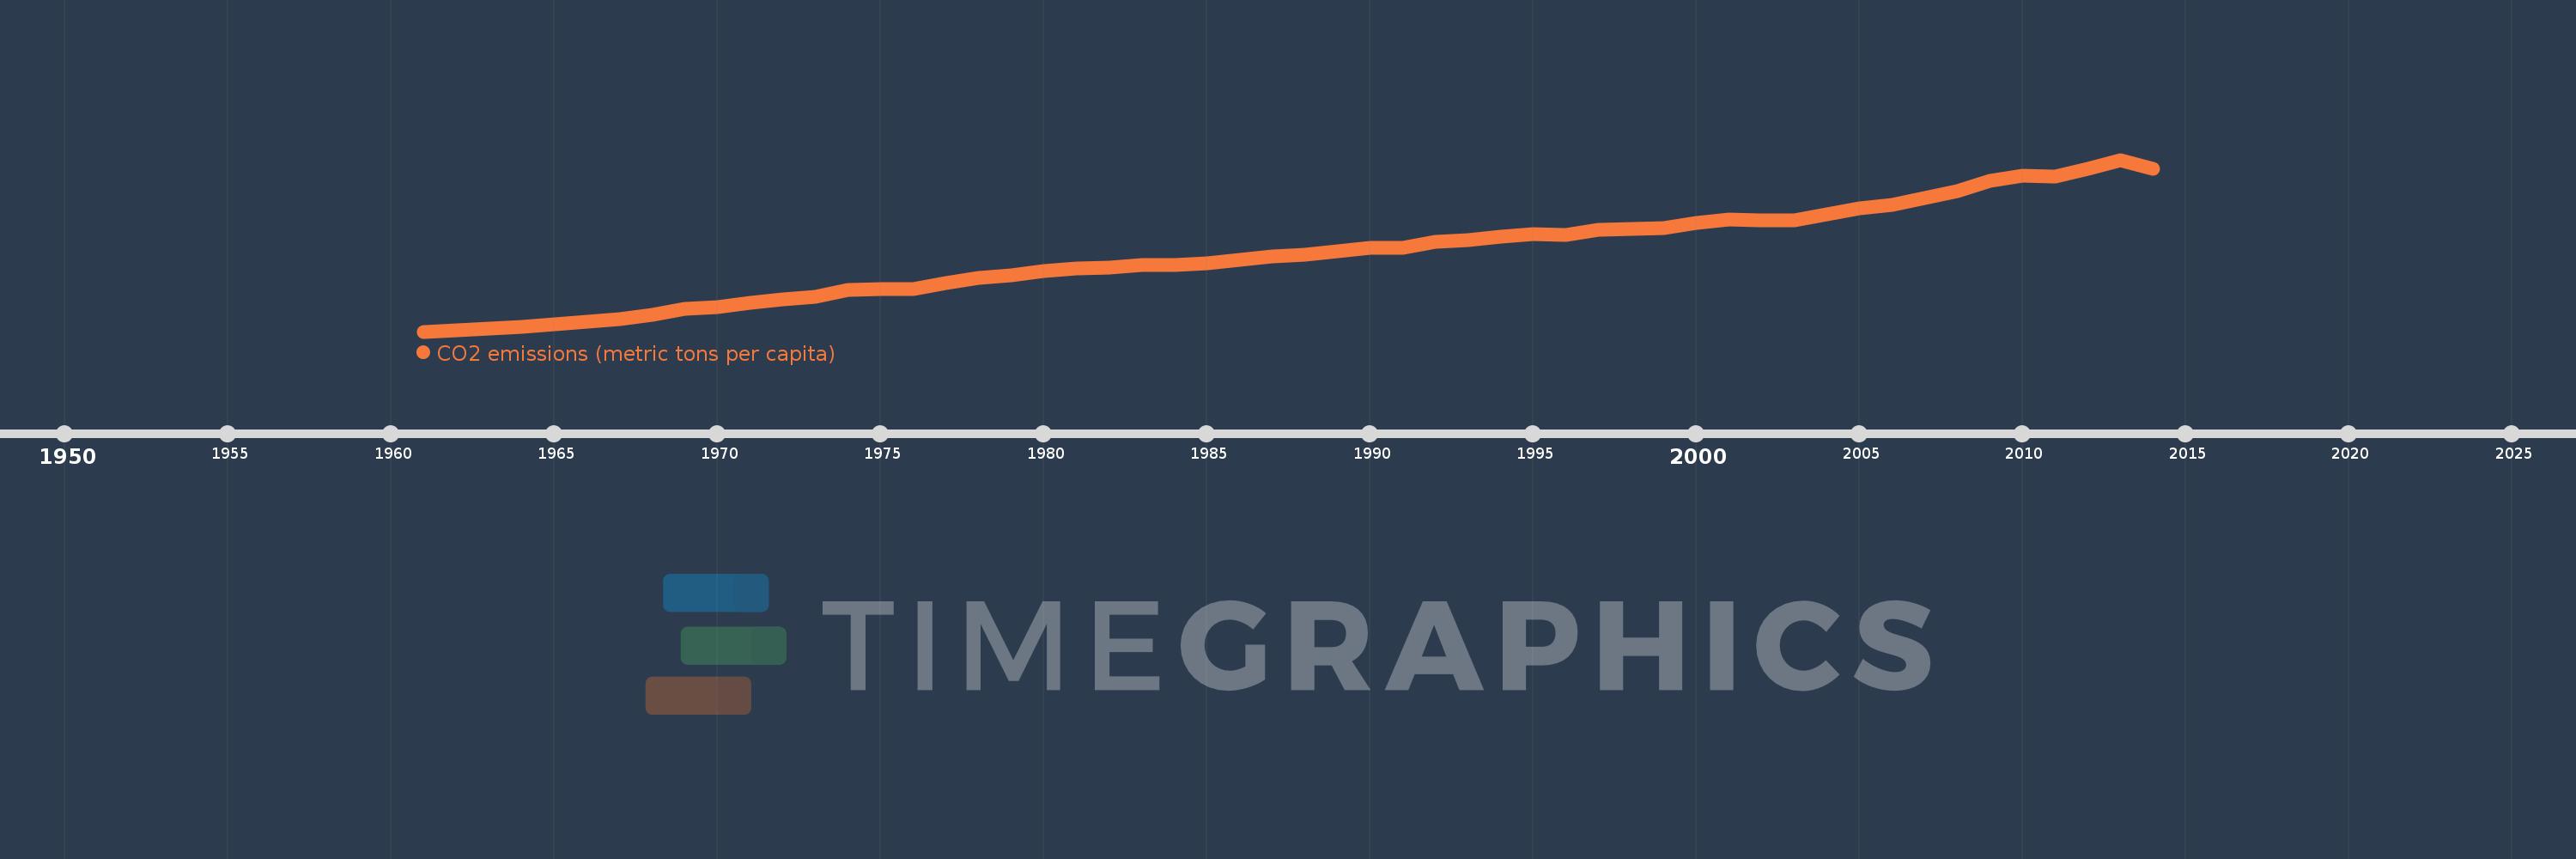
CO2 emissions (metric tons per capita)
2014,2013,2012,2011,2010,2009,2008,2007,2006,2005,2004,2003,2002,2001,2000,1999,1998,1997,1996,1995,1994,1993,1992,1991,1990,1989,1988,1987,1986,1985,1984,1983,1982,1981,1980,1979,1978,1977,1976,1975,1974,1973,1972,1971,1970,1969,1968,1967,1966,1965,1964,1963,1962,1961
Estas estadísticas en otros países:
AfghanistanAlbaniaAlgeriaAndorraAngolaAntigua and BarbudaArab WorldArgentinaArmeniaArubaAustraliaAustriaAzerbaijanBahamas, TheBahrainBangladeshBarbadosBelarusBelgiumBelizeBeninBermudaBhutanBoliviaBosnia and HerzegovinaBotswanaBrazilBritish Virgin IslandsBrunei DarussalamBulgariaBurkina FasoBurundiCabo VerdeCambodiaCameroonCanadaCaribbean small statesCayman IslandsCentral African RepublicCentral Europe and the BalticsChadChileChinaColombiaComorosCongo, Dem. Rep.Congo, Rep.Costa RicaCote d'IvoireCroatiaCubaCuracaoCyprusCzech RepublicDenmarkDjiboutiDominicaDominican RepublicEarly-demographic dividendEast Asia & PacificEast Asia & Pacific (excluding high income)East Asia & Pacific (IDA & IBRD countries)EcuadorEgypt, Arab Rep.El SalvadorEquatorial GuineaEritreaEstoniaEthiopiaEuro areaEurope & Central AsiaEurope & Central Asia (excluding high income)Europe & Central Asia (IDA & IBRD countries)European UnionFaroe IslandsFijiFinlandFragile and conflict affected situationsFranceFrench PolynesiaGabonGambia, TheGeorgiaGermanyGhanaGibraltarGreeceGreenlandGrenadaGuatemalaGuineaGuinea-BissauGuyanaHaitiHeavily indebted poor countries (HIPC)High incomeHondurasHong Kong SAR, ChinaHungaryIBRD onlyIcelandIDA & IBRD totalIDA blendIDA onlyIDA totalIndiaIndonesiaIran, Islamic Rep.IraqIrelandIsraelItalyJamaicaJapanJordanKazakhstanKenyaKiribatiKorea, Dem. People’s Rep.Korea, Rep.KuwaitKyrgyz RepublicLao PDRLate-demographic dividendLatin America & Caribbean Latin America & Caribbean (excluding high income)Latin America & the Caribbean (IDA & IBRD countries)LatviaLeast developed countries: UN classificationLebanonLesothoLiberiaLibyaLiechtensteinLithuaniaLow & middle incomeLow incomeLower middle incomeLuxembourgMacao SAR, ChinaMacedonia, FYRMadagascarMalawiMalaysiaMaldivesMaliMaltaMarshall IslandsMauritaniaMauritiusMexicoMicronesia, Fed. Sts.Middle East & North AfricaMiddle East & North Africa (excluding high income)Middle East & North Africa (IDA & IBRD countries)Middle incomeMoldovaMongoliaMontenegroMoroccoMozambiqueMyanmarNamibiaNauruNepalNetherlandsNew CaledoniaNew ZealandNicaraguaNigerNigeriaNorth AmericaNorwayOECD membersOmanOther small statesPacific island small statesPakistanPalauPanamaPapua New GuineaParaguayPeruPhilippinesPolandPortugalPost-demographic dividendPre-demographic dividendQatarRomaniaRussian FederationRwandaSamoaSao Tome and PrincipeSaudi ArabiaSenegalSerbiaSeychellesSierra LeoneSingaporeSint Maarten (Dutch part)Slovak RepublicSloveniaSmall statesSolomon IslandsSomaliaSouth AfricaSouth AsiaSouth Asia (IDA & IBRD)South SudanSpainSri LankaSt. Kitts and NevisSt. LuciaSt. Vincent and the GrenadinesSub-Saharan Africa Sub-Saharan Africa (excluding high income)Sub-Saharan Africa (IDA & IBRD countries)SudanSurinameSwazilandSwedenSwitzerlandSyrian Arab RepublicTajikistanTanzaniaThailandTimor-LesteTogoTongaTrinidad and TobagoTunisiaTurkeyTurkmenistanTurks and Caicos IslandsUgandaUkraineUnited Arab EmiratesUnited KingdomUnited StatesUpper middle incomeUruguayUzbekistanVanuatuVenezuela, RBVietnamWest Bank and GazaWorldYemen, Rep.ZambiaZimbabwe línea de tiempo (timeline):
En esta escala de tiempo se presenta un gráfico de 1961 y 2014 de Early-demographic dividend. Los datos de 1960 están ausentes. El número de observaciones reales por fecha: 54.
Fuente (nombre):
Indicadores del desarrollo mundial
Fuente (organización):
Carbon Dioxide Information Analysis Center, Environmental Sciences Division, Oak Ridge National Laboratory, Tennessee, United States.
Categorías:
Climate Change, Environment
Se ha actualizado:
23 abr 2017 año
Los indicadores de los cambios de valor en los últimos años
Mínimo:
0.594
1 ene 1961 año
Máximo:
2.298
1 ene 2013 año
A la fecha de observación
Valor
Cambio absoluto
El cambio con respecto al valor anterior
1 ene 1961 año
0.594
+0.594
0.0%
1 ene 1962 año
0.604
+0.01
1.7%
1 ene 1963 año
0.624
+0.02
3.3%
1 ene 1964 año
0.638
+0.014
2.32%
1 ene 1965 año
0.665
+0.026
4.14%
1 ene 1966 año
0.696
+0.031
4.65%
1 ene 1967 año
0.714
+0.018
2.59%
1 ene 1968 año
0.757
+0.043
6.08%
1 ene 1969 año
0.818
+0.061
8.11%
1 ene 1970 año
0.839
+0.021
2.57%
1 ene 1971 año
0.881
+0.041
4.92%
1 ene 1972 año
0.917
+0.036
4.1%
1 ene 1973 año
0.935
+0.018
1.99%
1 ene 1974 año
1.004
+0.069
7.37%
1 ene 1975 año
1.018
+0.014
1.35%
1 ene 1976 año
1.015
-0.002
-0.24%
1 ene 1977 año
1.077
+0.062
6.11%
1 ene 1978 año
1.127
+0.05
4.61%
1 ene 1979 año
1.155
+0.028
2.48%
1 ene 1980 año
1.191
+0.036
3.1%
1 ene 1981 año
1.218
+0.027
2.27%
1 ene 1982 año
1.233
+0.015
1.25%
1 ene 1983 año
1.256
+0.023
1.89%
1 ene 1984 año
1.257
+0.001
0.09%
1 ene 1985 año
1.269
+0.012
0.96%
1 ene 1986 año
1.304
+0.035
2.77%
1 ene 1987 año
1.337
+0.033
2.51%
1 ene 1988 año
1.358
+0.021
1.59%
1 ene 1989 año
1.392
+0.034
2.49%
1 ene 1990 año
1.425
+0.033
2.34%
1 ene 1991 año
1.423
-0.002
-0.15%
1 ene 1992 año
1.484
+0.062
4.34%
1 ene 1993 año
1.5
+0.016
1.07%
1 ene 1994 año
1.537
+0.037
2.44%
1 ene 1995 año
1.563
+0.026
1.67%
1 ene 1996 año
1.553
-0.01
-0.64%
1 ene 1997 año
1.604
+0.051
3.31%
1 ene 1998 año
1.608
+0.004
0.27%
1 ene 1999 año
1.622
+0.013
0.84%
1 ene 2000 año
1.675
+0.053
3.27%
1 ene 2001 año
1.706
+0.031
1.86%
1 ene 2002 año
1.698
-0.008
-0.48%
1 ene 2003 año
1.698
+0.0
0.03%
1 ene 2004 año
1.754
+0.056
3.28%
1 ene 2005 año
1.815
+0.061
3.47%
1 ene 2006 año
1.848
+0.033
1.82%
1 ene 2007 año
1.918
+0.071
3.83%
1 ene 2008 año
1.984
+0.066
3.44%
1 ene 2009 año
2.089
+0.105
5.27%
1 ene 2010 año
2.137
+0.048
2.29%
1 ene 2011 año
2.13
-0.007
-0.34%
1 ene 2012 año
2.205
+0.075
3.53%
1 ene 2013 año
2.298
+0.093
4.24%
1 ene 2014 año
2.209
-0.089
-3.88%
Ranking de los países por los datos estadísticos actuales


Comentarios: