29
/es/
es
AIzaSyAYiBZKx7MnpbEhh9jyipgxe19OcubqV5w
April 1, 2024
216149
Pakistan
PAK
true
2
1
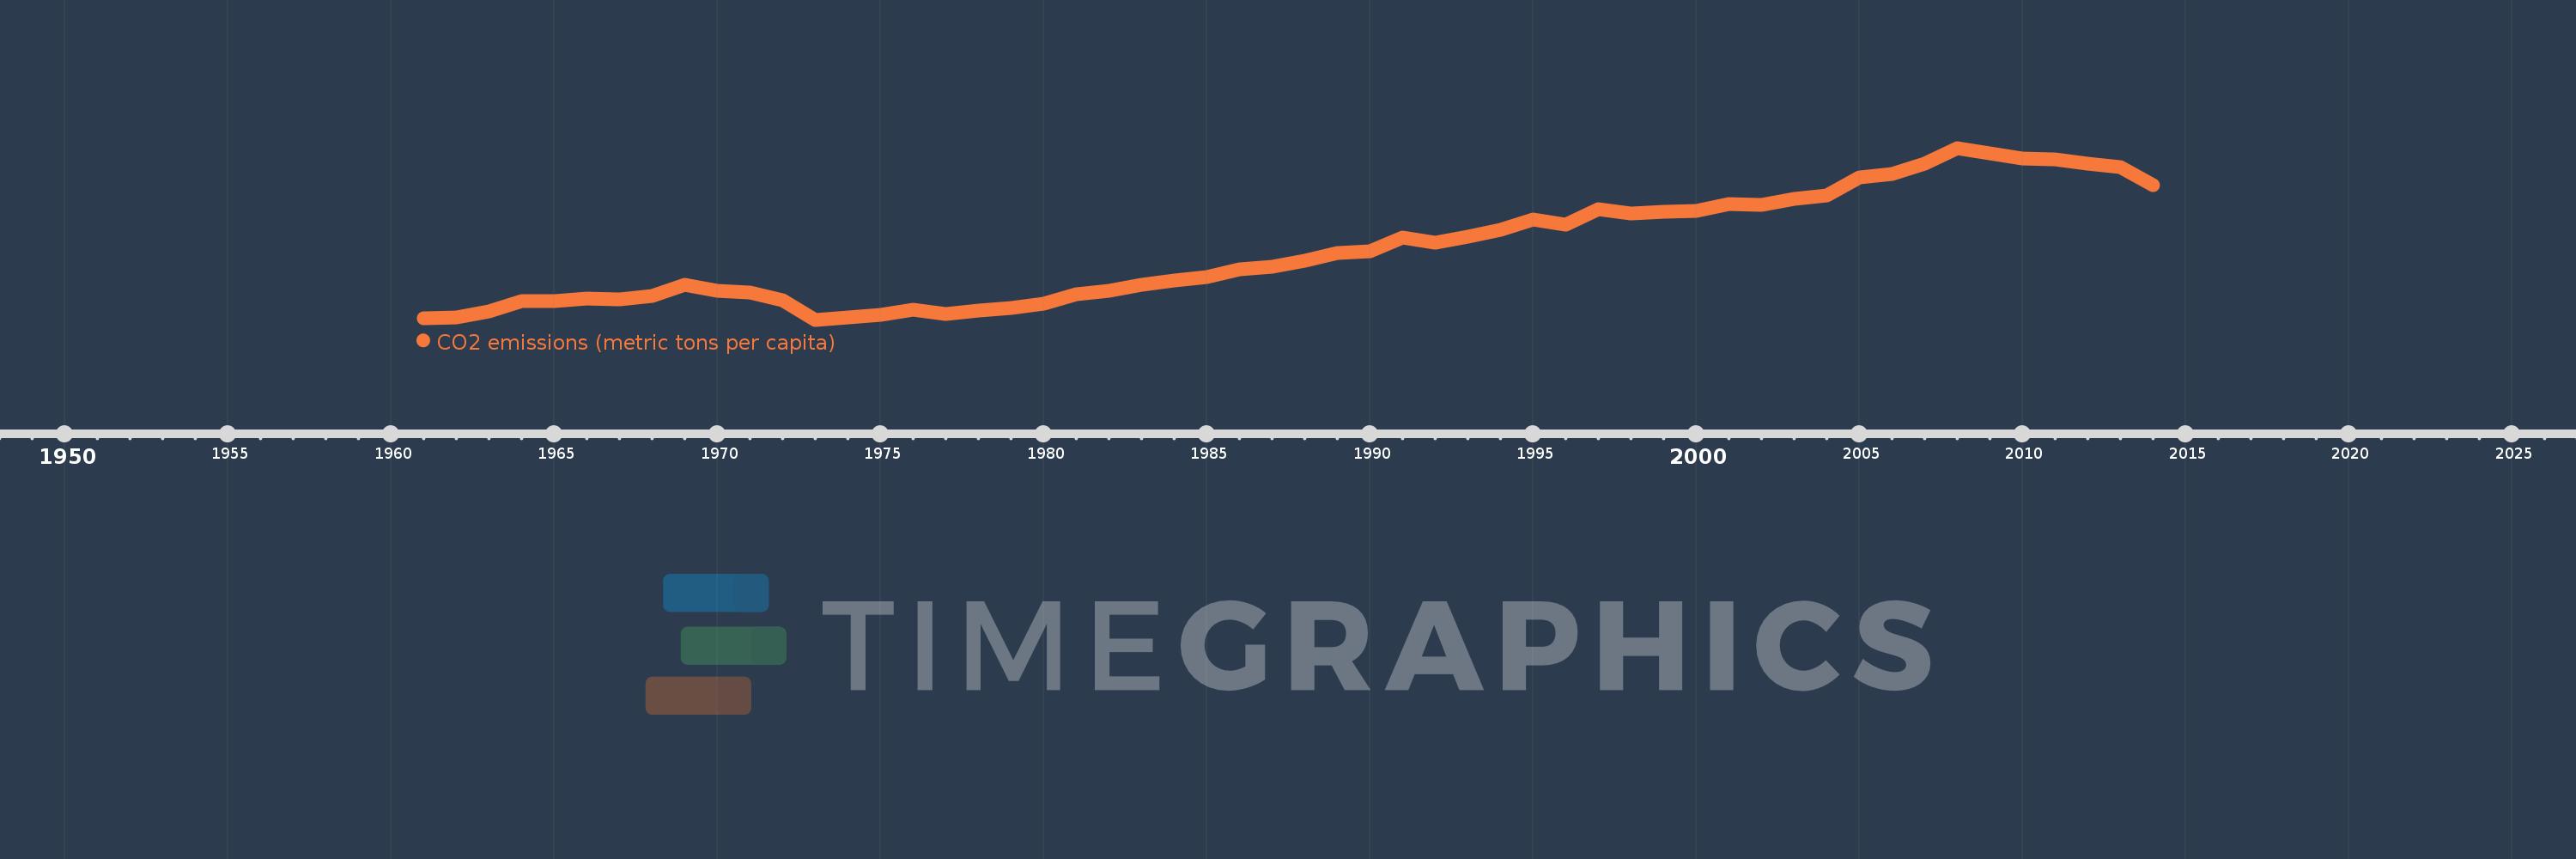
CO2 emissions (metric tons per capita)
2014,2013,2012,2011,2010,2009,2008,2007,2006,2005,2004,2003,2002,2001,2000,1999,1998,1997,1996,1995,1994,1993,1992,1991,1990,1989,1988,1987,1986,1985,1984,1983,1982,1981,1980,1979,1978,1977,1976,1975,1974,1973,1972,1971,1970,1969,1968,1967,1966,1965,1964,1963,1962,1961
Estas estadísticas en otros países:
AfghanistanAlbaniaAlgeriaAndorraAngolaAntigua and BarbudaArab WorldArgentinaArmeniaArubaAustraliaAustriaAzerbaijanBahamas, TheBahrainBangladeshBarbadosBelarusBelgiumBelizeBeninBermudaBhutanBoliviaBosnia and HerzegovinaBotswanaBrazilBritish Virgin IslandsBrunei DarussalamBulgariaBurkina FasoBurundiCabo VerdeCambodiaCameroonCanadaCaribbean small statesCayman IslandsCentral African RepublicCentral Europe and the BalticsChadChileChinaColombiaComorosCongo, Dem. Rep.Congo, Rep.Costa RicaCote d'IvoireCroatiaCubaCuracaoCyprusCzech RepublicDenmarkDjiboutiDominicaDominican RepublicEarly-demographic dividendEast Asia & PacificEast Asia & Pacific (excluding high income)East Asia & Pacific (IDA & IBRD countries)EcuadorEgypt, Arab Rep.El SalvadorEquatorial GuineaEritreaEstoniaEthiopiaEuro areaEurope & Central AsiaEurope & Central Asia (excluding high income)Europe & Central Asia (IDA & IBRD countries)European UnionFaroe IslandsFijiFinlandFragile and conflict affected situationsFranceFrench PolynesiaGabonGambia, TheGeorgiaGermanyGhanaGibraltarGreeceGreenlandGrenadaGuatemalaGuineaGuinea-BissauGuyanaHaitiHeavily indebted poor countries (HIPC)High incomeHondurasHong Kong SAR, ChinaHungaryIBRD onlyIcelandIDA & IBRD totalIDA blendIDA onlyIDA totalIndiaIndonesiaIran, Islamic Rep.IraqIrelandIsraelItalyJamaicaJapanJordanKazakhstanKenyaKiribatiKorea, Dem. People’s Rep.Korea, Rep.KuwaitKyrgyz RepublicLao PDRLate-demographic dividendLatin America & Caribbean Latin America & Caribbean (excluding high income)Latin America & the Caribbean (IDA & IBRD countries)LatviaLeast developed countries: UN classificationLebanonLesothoLiberiaLibyaLiechtensteinLithuaniaLow & middle incomeLow incomeLower middle incomeLuxembourgMacao SAR, ChinaMacedonia, FYRMadagascarMalawiMalaysiaMaldivesMaliMaltaMarshall IslandsMauritaniaMauritiusMexicoMicronesia, Fed. Sts.Middle East & North AfricaMiddle East & North Africa (excluding high income)Middle East & North Africa (IDA & IBRD countries)Middle incomeMoldovaMongoliaMontenegroMoroccoMozambiqueMyanmarNamibiaNauruNepalNetherlandsNew CaledoniaNew ZealandNicaraguaNigerNigeriaNorth AmericaNorwayOECD membersOmanOther small statesPacific island small statesPakistanPalauPanamaPapua New GuineaParaguayPeruPhilippinesPolandPortugalPost-demographic dividendPre-demographic dividendQatarRomaniaRussian FederationRwandaSamoaSao Tome and PrincipeSaudi ArabiaSenegalSerbiaSeychellesSierra LeoneSingaporeSint Maarten (Dutch part)Slovak RepublicSloveniaSmall statesSolomon IslandsSomaliaSouth AfricaSouth AsiaSouth Asia (IDA & IBRD)South SudanSpainSri LankaSt. Kitts and NevisSt. LuciaSt. Vincent and the GrenadinesSub-Saharan Africa Sub-Saharan Africa (excluding high income)Sub-Saharan Africa (IDA & IBRD countries)SudanSurinameSwazilandSwedenSwitzerlandSyrian Arab RepublicTajikistanTanzaniaThailandTimor-LesteTogoTongaTrinidad and TobagoTunisiaTurkeyTurkmenistanTurks and Caicos IslandsUgandaUkraineUnited Arab EmiratesUnited KingdomUnited StatesUpper middle incomeUruguayUzbekistanVanuatuVenezuela, RBVietnamWest Bank and GazaWorldYemen, Rep.ZambiaZimbabwe línea de tiempo (timeline):
En esta escala de tiempo se presenta un gráfico de 1961 y 2014 de Pakistan. Los datos de 1960 están ausentes. El número de observaciones reales por fecha: 54.
Fuente (nombre):
Indicadores del desarrollo mundial
Fuente (organización):
Carbon Dioxide Information Analysis Center, Environmental Sciences Division, Oak Ridge National Laboratory, Tennessee, United States.
Categorías:
Climate Change, Environment
Se ha actualizado:
23 abr 2017 año
Los indicadores de los cambios de valor en los últimos años
Mínimo:
0.309
1 ene 1973 año
Máximo:
0.995
1 ene 2008 año
A la fecha de observación
Valor
Cambio absoluto
El cambio con respecto al valor anterior
1 ene 1961 año
0.315
+0.315
0.0%
1 ene 1962 año
0.319
+0.004
1.13%
1 ene 1963 año
0.342
+0.023
7.24%
1 ene 1964 año
0.383
+0.041
12.13%
1 ene 1965 año
0.384
+0.001
0.23%
1 ene 1966 año
0.393
+0.009
2.26%
1 ene 1967 año
0.389
-0.003
-0.86%
1 ene 1968 año
0.403
+0.013
3.36%
1 ene 1969 año
0.449
+0.047
11.65%
1 ene 1970 año
0.424
-0.025
-5.58%
1 ene 1971 año
0.419
-0.005
-1.27%
1 ene 1972 año
0.387
-0.032
-7.72%
1 ene 1973 año
0.309
-0.078
-20.18%
1 ene 1974 año
0.318
+0.009
2.96%
1 ene 1975 año
0.33
+0.012
3.91%
1 ene 1976 año
0.348
+0.017
5.29%
1 ene 1977 año
0.332
-0.016
-4.54%
1 ene 1978 año
0.344
+0.012
3.58%
1 ene 1979 año
0.357
+0.013
3.88%
1 ene 1980 año
0.374
+0.017
4.69%
1 ene 1981 año
0.411
+0.037
9.88%
1 ene 1982 año
0.426
+0.016
3.79%
1 ene 1983 año
0.448
+0.022
5.11%
1 ene 1984 año
0.467
+0.019
4.26%
1 ene 1985 año
0.481
+0.013
2.85%
1 ene 1986 año
0.512
+0.031
6.52%
1 ene 1987 año
0.519
+0.008
1.48%
1 ene 1988 año
0.545
+0.025
4.85%
1 ene 1989 año
0.574
+0.029
5.4%
1 ene 1990 año
0.583
+0.009
1.6%
1 ene 1991 año
0.637
+0.054
9.27%
1 ene 1992 año
0.617
-0.02
-3.19%
1 ene 1993 año
0.641
+0.024
3.86%
1 ene 1994 año
0.669
+0.028
4.44%
1 ene 1995 año
0.71
+0.04
6.04%
1 ene 1996 año
0.689
-0.02
-2.88%
1 ene 1997 año
0.751
+0.062
9.04%
1 ene 1998 año
0.735
-0.016
-2.17%
1 ene 1999 año
0.74
+0.005
0.64%
1 ene 2000 año
0.743
+0.003
0.39%
1 ene 2001 año
0.77
+0.027
3.67%
1 ene 2002 año
0.766
-0.004
-0.46%
1 ene 2003 año
0.791
+0.024
3.17%
1 ene 2004 año
0.807
+0.017
2.11%
1 ene 2005 año
0.876
+0.068
8.46%
1 ene 2006 año
0.891
+0.015
1.73%
1 ene 2007 año
0.933
+0.042
4.74%
1 ene 2008 año
0.995
+0.061
6.57%
1 ene 2009 año
0.975
-0.019
-1.93%
1 ene 2010 año
0.954
-0.021
-2.2%
1 ene 2011 año
0.949
-0.005
-0.49%
1 ene 2012 año
0.933
-0.016
-1.72%
1 ene 2013 año
0.919
-0.014
-1.46%
1 ene 2014 año
0.846
-0.073
-7.92%
Ranking de los países por los datos estadísticos actuales


Comentarios: