29
/es/
es
AIzaSyAYiBZKx7MnpbEhh9jyipgxe19OcubqV5w
April 1, 2024
212719
Nigeria
NGA
true
2
1
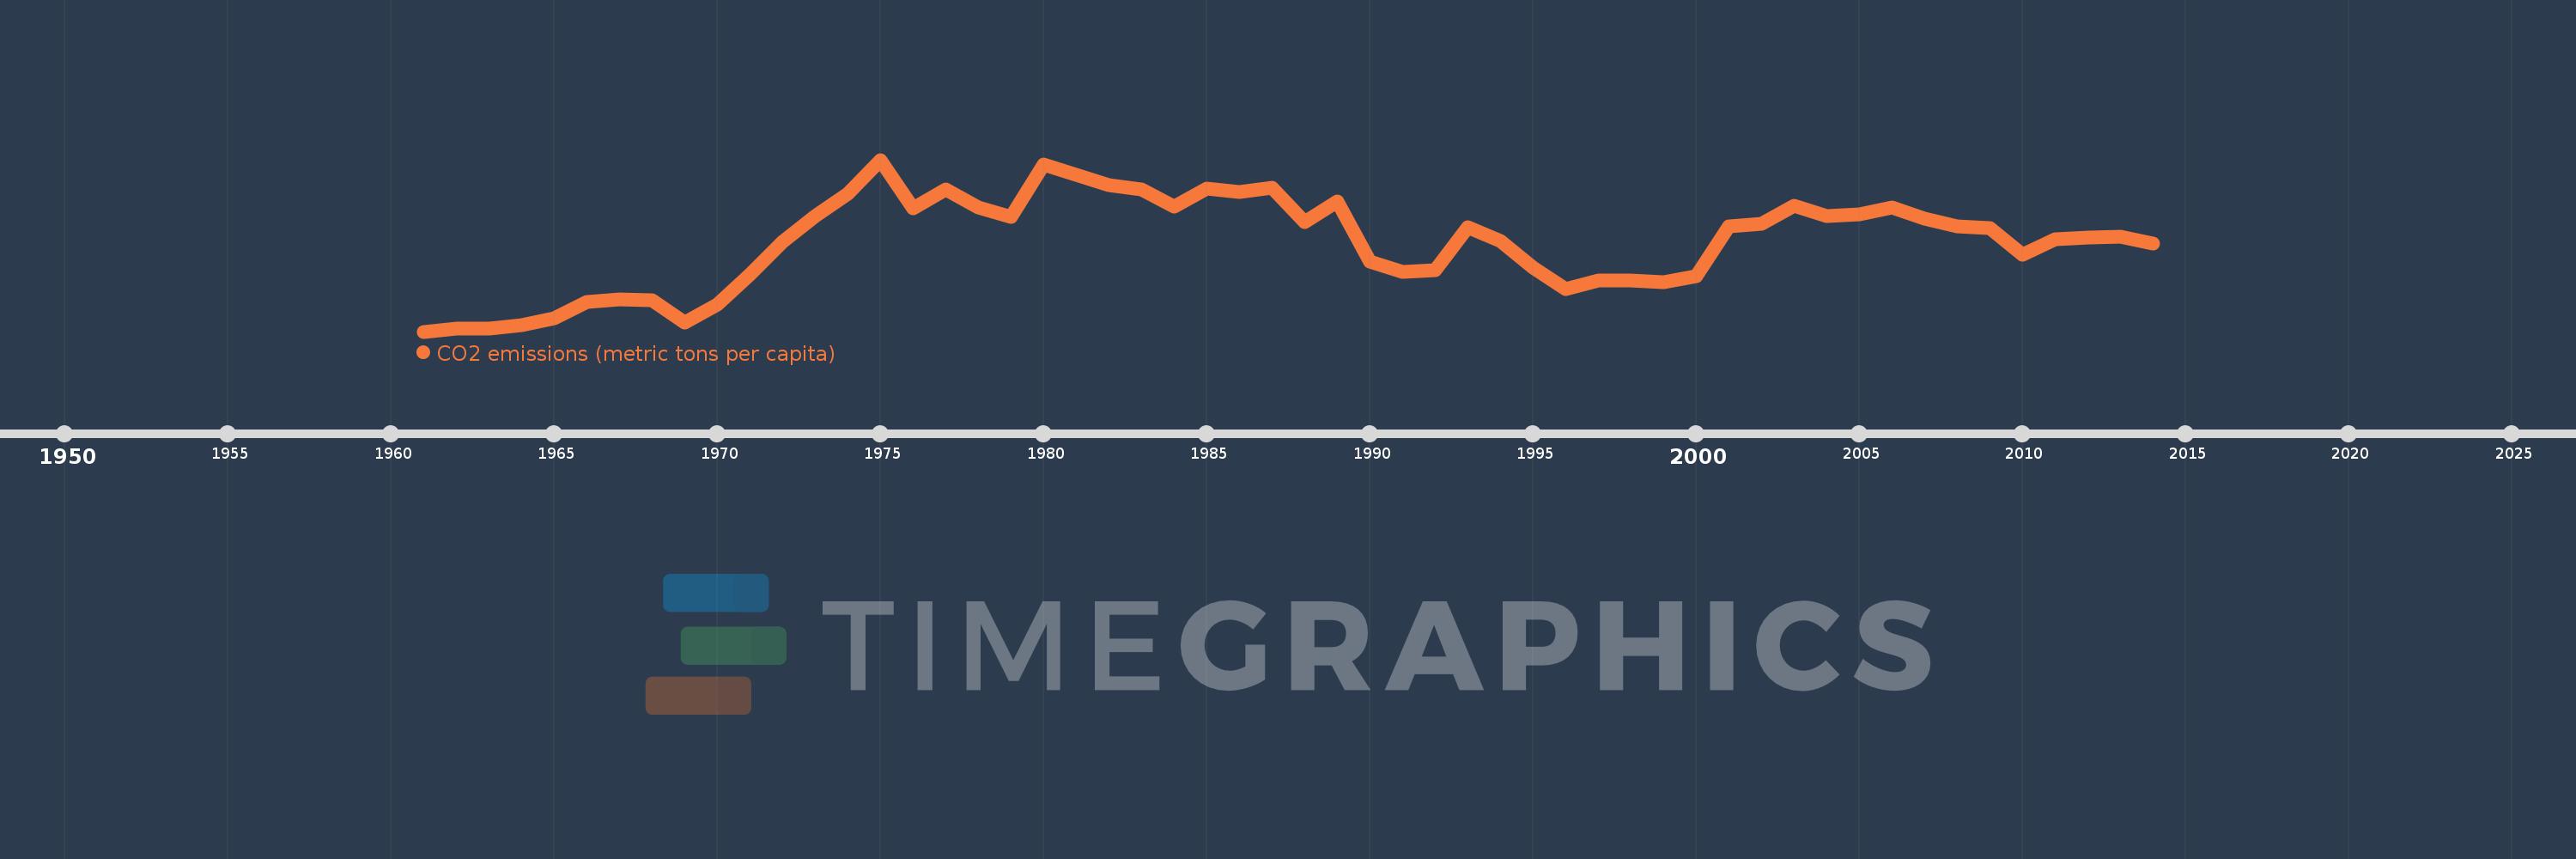
CO2 emissions (metric tons per capita)
2014,2013,2012,2011,2010,2009,2008,2007,2006,2005,2004,2003,2002,2001,2000,1999,1998,1997,1996,1995,1994,1993,1992,1991,1990,1989,1988,1987,1986,1985,1984,1983,1982,1981,1980,1979,1978,1977,1976,1975,1974,1973,1972,1971,1970,1969,1968,1967,1966,1965,1964,1963,1962,1961
Estas estadísticas en otros países:
AfghanistanAlbaniaAlgeriaAndorraAngolaAntigua and BarbudaArab WorldArgentinaArmeniaArubaAustraliaAustriaAzerbaijanBahamas, TheBahrainBangladeshBarbadosBelarusBelgiumBelizeBeninBermudaBhutanBoliviaBosnia and HerzegovinaBotswanaBrazilBritish Virgin IslandsBrunei DarussalamBulgariaBurkina FasoBurundiCabo VerdeCambodiaCameroonCanadaCaribbean small statesCayman IslandsCentral African RepublicCentral Europe and the BalticsChadChileChinaColombiaComorosCongo, Dem. Rep.Congo, Rep.Costa RicaCote d'IvoireCroatiaCubaCuracaoCyprusCzech RepublicDenmarkDjiboutiDominicaDominican RepublicEarly-demographic dividendEast Asia & PacificEast Asia & Pacific (excluding high income)East Asia & Pacific (IDA & IBRD countries)EcuadorEgypt, Arab Rep.El SalvadorEquatorial GuineaEritreaEstoniaEthiopiaEuro areaEurope & Central AsiaEurope & Central Asia (excluding high income)Europe & Central Asia (IDA & IBRD countries)European UnionFaroe IslandsFijiFinlandFragile and conflict affected situationsFranceFrench PolynesiaGabonGambia, TheGeorgiaGermanyGhanaGibraltarGreeceGreenlandGrenadaGuatemalaGuineaGuinea-BissauGuyanaHaitiHeavily indebted poor countries (HIPC)High incomeHondurasHong Kong SAR, ChinaHungaryIBRD onlyIcelandIDA & IBRD totalIDA blendIDA onlyIDA totalIndiaIndonesiaIran, Islamic Rep.IraqIrelandIsraelItalyJamaicaJapanJordanKazakhstanKenyaKiribatiKorea, Dem. People’s Rep.Korea, Rep.KuwaitKyrgyz RepublicLao PDRLate-demographic dividendLatin America & Caribbean Latin America & Caribbean (excluding high income)Latin America & the Caribbean (IDA & IBRD countries)LatviaLeast developed countries: UN classificationLebanonLesothoLiberiaLibyaLiechtensteinLithuaniaLow & middle incomeLow incomeLower middle incomeLuxembourgMacao SAR, ChinaMacedonia, FYRMadagascarMalawiMalaysiaMaldivesMaliMaltaMarshall IslandsMauritaniaMauritiusMexicoMicronesia, Fed. Sts.Middle East & North AfricaMiddle East & North Africa (excluding high income)Middle East & North Africa (IDA & IBRD countries)Middle incomeMoldovaMongoliaMontenegroMoroccoMozambiqueMyanmarNamibiaNauruNepalNetherlandsNew CaledoniaNew ZealandNicaraguaNigerNigeriaNorth AmericaNorwayOECD membersOmanOther small statesPacific island small statesPakistanPalauPanamaPapua New GuineaParaguayPeruPhilippinesPolandPortugalPost-demographic dividendPre-demographic dividendQatarRomaniaRussian FederationRwandaSamoaSao Tome and PrincipeSaudi ArabiaSenegalSerbiaSeychellesSierra LeoneSingaporeSint Maarten (Dutch part)Slovak RepublicSloveniaSmall statesSolomon IslandsSomaliaSouth AfricaSouth AsiaSouth Asia (IDA & IBRD)South SudanSpainSri LankaSt. Kitts and NevisSt. LuciaSt. Vincent and the GrenadinesSub-Saharan Africa Sub-Saharan Africa (excluding high income)Sub-Saharan Africa (IDA & IBRD countries)SudanSurinameSwazilandSwedenSwitzerlandSyrian Arab RepublicTajikistanTanzaniaThailandTimor-LesteTogoTongaTrinidad and TobagoTunisiaTurkeyTurkmenistanTurks and Caicos IslandsUgandaUkraineUnited Arab EmiratesUnited KingdomUnited StatesUpper middle incomeUruguayUzbekistanVanuatuVenezuela, RBVietnamWest Bank and GazaWorldYemen, Rep.ZambiaZimbabwe línea de tiempo (timeline):
En esta escala de tiempo se presenta un gráfico de 1961 y 2014 de Nigeria. Los datos de 1960 están ausentes. El número de observaciones reales por fecha: 54.
Fuente (nombre):
Indicadores del desarrollo mundial
Fuente (organización):
Carbon Dioxide Information Analysis Center, Environmental Sciences Division, Oak Ridge National Laboratory, Tennessee, United States.
Categorías:
Climate Change, Environment
Se ha actualizado:
23 abr 2017 año
Los indicadores de los cambios de valor en los últimos años
Mínimo:
0.075
1 ene 1961 año
Máximo:
1.007
1 ene 1975 año
A la fecha de observación
Valor
Cambio absoluto
El cambio con respecto al valor anterior
1 ene 1961 año
0.075
+0.075
0.0%
1 ene 1962 año
0.089
+0.014
18.33%
1 ene 1963 año
0.089
0.0
-0.5%
1 ene 1964 año
0.111
+0.022
25.3%
1 ene 1965 año
0.148
+0.037
33.1%
1 ene 1966 año
0.234
+0.086
58.25%
1 ene 1967 año
0.251
+0.017
7.38%
1 ene 1968 año
0.245
-0.007
-2.69%
1 ene 1969 año
0.124
-0.121
-49.46%
1 ene 1970 año
0.221
+0.097
78.53%
1 ene 1971 año
0.384
+0.163
73.81%
1 ene 1972 año
0.562
+0.178
46.42%
1 ene 1973 año
0.704
+0.142
25.33%
1 ene 1974 año
0.822
+0.118
16.79%
1 ene 1975 año
1.007
+0.185
22.45%
1 ene 1976 año
0.746
-0.261
-25.96%
1 ene 1977 año
0.844
+0.099
13.25%
1 ene 1978 año
0.75
-0.094
-11.18%
1 ene 1979 año
0.695
-0.055
-7.36%
1 ene 1980 año
0.981
+0.287
41.26%
1 ene 1981 año
0.925
-0.057
-5.77%
1 ene 1982 año
0.871
-0.054
-5.82%
1 ene 1983 año
0.844
-0.027
-3.1%
1 ene 1984 año
0.752
-0.092
-10.94%
1 ene 1985 año
0.851
+0.1
13.27%
1 ene 1986 año
0.833
-0.018
-2.16%
1 ene 1987 año
0.854
+0.021
2.46%
1 ene 1988 año
0.671
-0.182
-21.36%
1 ene 1989 año
0.779
+0.108
16.12%
1 ene 1990 año
0.455
-0.324
-41.56%
1 ene 1991 año
0.399
-0.056
-12.38%
1 ene 1992 año
0.408
+0.009
2.21%
1 ene 1993 año
0.639
+0.231
56.66%
1 ene 1994 año
0.565
-0.074
-11.61%
1 ene 1995 año
0.424
-0.141
-24.9%
1 ene 1996 año
0.307
-0.117
-27.68%
1 ene 1997 año
0.35
+0.043
14.16%
1 ene 1998 año
0.352
+0.002
0.64%
1 ene 1999 año
0.344
-0.009
-2.5%
1 ene 2000 año
0.374
+0.03
8.72%
1 ene 2001 año
0.644
+0.271
72.43%
1 ene 2002 año
0.661
+0.017
2.64%
1 ene 2003 año
0.759
+0.098
14.78%
1 ene 2004 año
0.702
-0.057
-7.47%
1 ene 2005 año
0.713
+0.011
1.55%
1 ene 2006 año
0.75
+0.037
5.12%
1 ene 2007 año
0.69
-0.06
-7.98%
1 ene 2008 año
0.646
-0.044
-6.38%
1 ene 2009 año
0.636
-0.01
-1.5%
1 ene 2010 año
0.494
-0.142
-22.29%
1 ene 2011 año
0.577
+0.083
16.74%
1 ene 2012 año
0.587
+0.01
1.66%
1 ene 2013 año
0.592
+0.005
0.93%
1 ene 2014 año
0.553
-0.039
-6.54%
Ranking de los países por los datos estadísticos actuales


Comentarios: