29
/es/
es
AIzaSyAYiBZKx7MnpbEhh9jyipgxe19OcubqV5w
April 1, 2024
161275
Italy
ITA
true
2
1
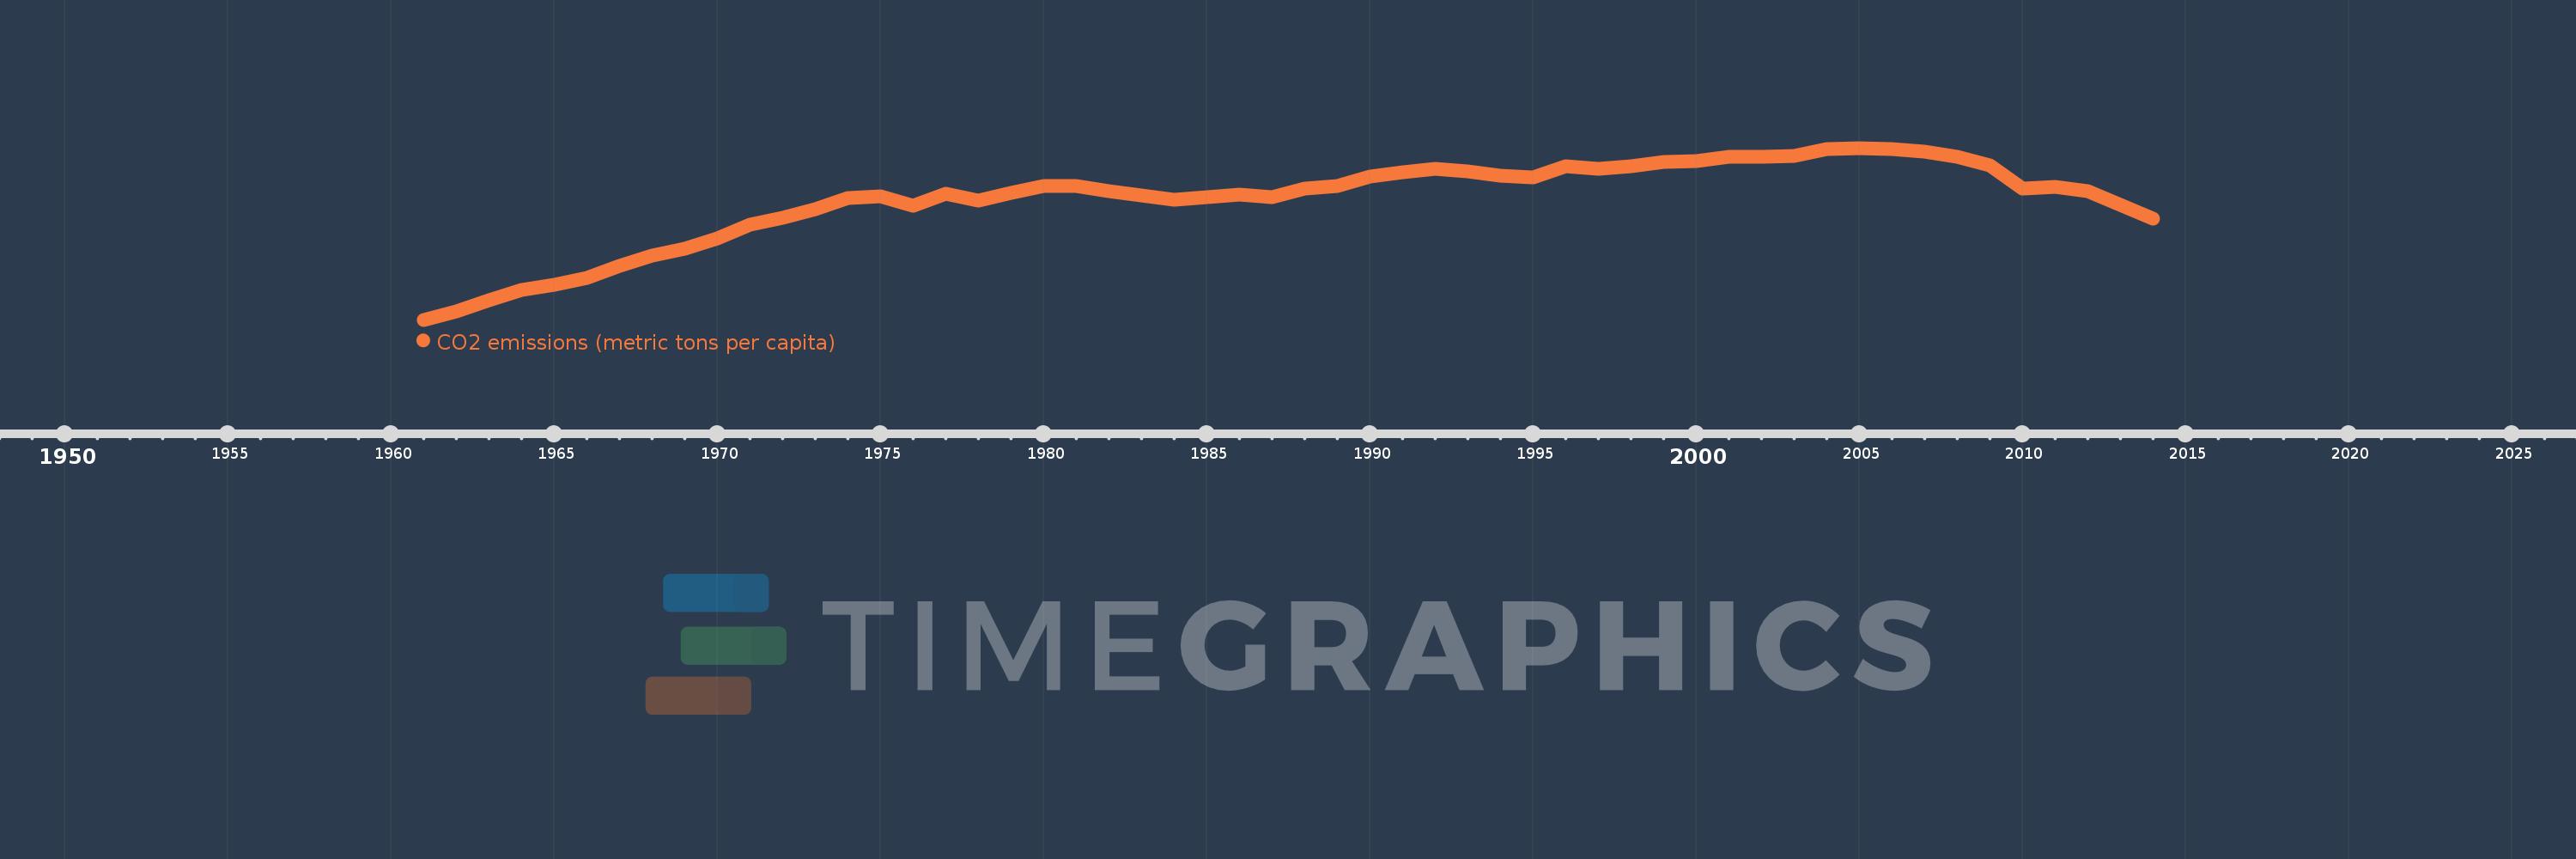
CO2 emissions (metric tons per capita)
2014,2013,2012,2011,2010,2009,2008,2007,2006,2005,2004,2003,2002,2001,2000,1999,1998,1997,1996,1995,1994,1993,1992,1991,1990,1989,1988,1987,1986,1985,1984,1983,1982,1981,1980,1979,1978,1977,1976,1975,1974,1973,1972,1971,1970,1969,1968,1967,1966,1965,1964,1963,1962,1961
Estas estadísticas en otros países:
AfghanistanAlbaniaAlgeriaAndorraAngolaAntigua and BarbudaArab WorldArgentinaArmeniaArubaAustraliaAustriaAzerbaijanBahamas, TheBahrainBangladeshBarbadosBelarusBelgiumBelizeBeninBermudaBhutanBoliviaBosnia and HerzegovinaBotswanaBrazilBritish Virgin IslandsBrunei DarussalamBulgariaBurkina FasoBurundiCabo VerdeCambodiaCameroonCanadaCaribbean small statesCayman IslandsCentral African RepublicCentral Europe and the BalticsChadChileChinaColombiaComorosCongo, Dem. Rep.Congo, Rep.Costa RicaCote d'IvoireCroatiaCubaCuracaoCyprusCzech RepublicDenmarkDjiboutiDominicaDominican RepublicEarly-demographic dividendEast Asia & PacificEast Asia & Pacific (excluding high income)East Asia & Pacific (IDA & IBRD countries)EcuadorEgypt, Arab Rep.El SalvadorEquatorial GuineaEritreaEstoniaEthiopiaEuro areaEurope & Central AsiaEurope & Central Asia (excluding high income)Europe & Central Asia (IDA & IBRD countries)European UnionFaroe IslandsFijiFinlandFragile and conflict affected situationsFranceFrench PolynesiaGabonGambia, TheGeorgiaGermanyGhanaGibraltarGreeceGreenlandGrenadaGuatemalaGuineaGuinea-BissauGuyanaHaitiHeavily indebted poor countries (HIPC)High incomeHondurasHong Kong SAR, ChinaHungaryIBRD onlyIcelandIDA & IBRD totalIDA blendIDA onlyIDA totalIndiaIndonesiaIran, Islamic Rep.IraqIrelandIsraelItalyJamaicaJapanJordanKazakhstanKenyaKiribatiKorea, Dem. People’s Rep.Korea, Rep.KuwaitKyrgyz RepublicLao PDRLate-demographic dividendLatin America & Caribbean Latin America & Caribbean (excluding high income)Latin America & the Caribbean (IDA & IBRD countries)LatviaLeast developed countries: UN classificationLebanonLesothoLiberiaLibyaLiechtensteinLithuaniaLow & middle incomeLow incomeLower middle incomeLuxembourgMacao SAR, ChinaMacedonia, FYRMadagascarMalawiMalaysiaMaldivesMaliMaltaMarshall IslandsMauritaniaMauritiusMexicoMicronesia, Fed. Sts.Middle East & North AfricaMiddle East & North Africa (excluding high income)Middle East & North Africa (IDA & IBRD countries)Middle incomeMoldovaMongoliaMontenegroMoroccoMozambiqueMyanmarNamibiaNauruNepalNetherlandsNew CaledoniaNew ZealandNicaraguaNigerNigeriaNorth AmericaNorwayOECD membersOmanOther small statesPacific island small statesPakistanPalauPanamaPapua New GuineaParaguayPeruPhilippinesPolandPortugalPost-demographic dividendPre-demographic dividendQatarRomaniaRussian FederationRwandaSamoaSao Tome and PrincipeSaudi ArabiaSenegalSerbiaSeychellesSierra LeoneSingaporeSint Maarten (Dutch part)Slovak RepublicSloveniaSmall statesSolomon IslandsSomaliaSouth AfricaSouth AsiaSouth Asia (IDA & IBRD)South SudanSpainSri LankaSt. Kitts and NevisSt. LuciaSt. Vincent and the GrenadinesSub-Saharan Africa Sub-Saharan Africa (excluding high income)Sub-Saharan Africa (IDA & IBRD countries)SudanSurinameSwazilandSwedenSwitzerlandSyrian Arab RepublicTajikistanTanzaniaThailandTimor-LesteTogoTongaTrinidad and TobagoTunisiaTurkeyTurkmenistanTurks and Caicos IslandsUgandaUkraineUnited Arab EmiratesUnited KingdomUnited StatesUpper middle incomeUruguayUzbekistanVanuatuVenezuela, RBVietnamWest Bank and GazaWorldYemen, Rep.ZambiaZimbabwe línea de tiempo (timeline):
En esta escala de tiempo se presenta un gráfico de 1961 y 2014 de Italy. Los datos de 1960 están ausentes. El número de observaciones reales por fecha: 54.
Fuente (nombre):
Indicadores del desarrollo mundial
Fuente (organización):
Carbon Dioxide Information Analysis Center, Environmental Sciences Division, Oak Ridge National Laboratory, Tennessee, United States.
Categorías:
Climate Change, Environment
Se ha actualizado:
23 abr 2017 año
Los indicadores de los cambios de valor en los últimos años
Mínimo:
2.178
1 ene 1961 año
Máximo:
8.216
1 ene 2005 año
A la fecha de observación
Valor
Cambio absoluto
El cambio con respecto al valor anterior
1 ene 1961 año
2.178
+2.178
0.0%
1 ene 1962 año
2.465
+0.286
13.13%
1 ene 1963 año
2.878
+0.414
16.8%
1 ene 1964 año
3.215
+0.337
11.69%
1 ene 1965 año
3.405
+0.19
5.91%
1 ene 1966 año
3.642
+0.236
6.94%
1 ene 1967 año
4.079
+0.438
12.03%
1 ene 1968 año
4.431
+0.352
8.63%
1 ene 1969 año
4.687
+0.255
5.76%
1 ene 1970 año
5.043
+0.357
7.61%
1 ene 1971 año
5.513
+0.47
9.32%
1 ene 1972 año
5.762
+0.249
4.51%
1 ene 1973 año
6.049
+0.287
4.98%
1 ene 1974 año
6.471
+0.422
6.98%
1 ene 1975 año
6.522
+0.05
0.77%
1 ene 1976 año
6.174
-0.347
-5.32%
1 ene 1977 año
6.592
+0.418
6.77%
1 ene 1978 año
6.365
-0.227
-3.44%
1 ene 1979 año
6.646
+0.281
4.42%
1 ene 1980 año
6.88
+0.234
3.51%
1 ene 1981 año
6.892
+0.012
0.18%
1 ene 1982 año
6.69
-0.202
-2.93%
1 ene 1983 año
6.538
-0.152
-2.28%
1 ene 1984 año
6.389
-0.149
-2.29%
1 ene 1985 año
6.498
+0.11
1.72%
1 ene 1986 año
6.576
+0.077
1.19%
1 ene 1987 año
6.475
-0.101
-1.53%
1 ene 1988 año
6.778
+0.304
4.69%
1 ene 1989 año
6.883
+0.105
1.54%
1 ene 1990 año
7.215
+0.332
4.83%
1 ene 1991 año
7.362
+0.146
2.03%
1 ene 1992 año
7.468
+0.107
1.45%
1 ene 1993 año
7.404
-0.064
-0.86%
1 ene 1994 año
7.248
-0.156
-2.11%
1 ene 1995 año
7.167
-0.081
-1.12%
1 ene 1996 año
7.573
+0.406
5.67%
1 ene 1997 año
7.489
-0.084
-1.11%
1 ene 1998 año
7.567
+0.078
1.04%
1 ene 1999 año
7.735
+0.168
2.22%
1 ene 2000 año
7.766
+0.031
0.4%
1 ene 2001 año
7.913
+0.147
1.89%
1 ene 2002 año
7.904
-0.008
-0.1%
1 ene 2003 año
7.932
+0.028
0.35%
1 ene 2004 año
8.172
+0.239
3.02%
1 ene 2005 año
8.216
+0.045
0.55%
1 ene 2006 año
8.166
-0.05
-0.61%
1 ene 2007 año
8.072
-0.094
-1.15%
1 ene 2008 año
7.917
-0.155
-1.92%
1 ene 2009 año
7.602
-0.316
-3.99%
1 ene 2010 año
6.796
-0.806
-10.6%
1 ene 2011 año
6.838
+0.043
0.63%
1 ene 2012 año
6.703
-0.136
-1.99%
1 ene 2013 año
6.205
-0.498
-7.42%
1 ene 2014 año
5.724
-0.481
-7.76%
Ranking de los países por los datos estadísticos actuales


Comentarios: