29
/es/
es
AIzaSyAYiBZKx7MnpbEhh9jyipgxe19OcubqV5w
April 1, 2024
257891
Switzerland
CHE
true
2
1
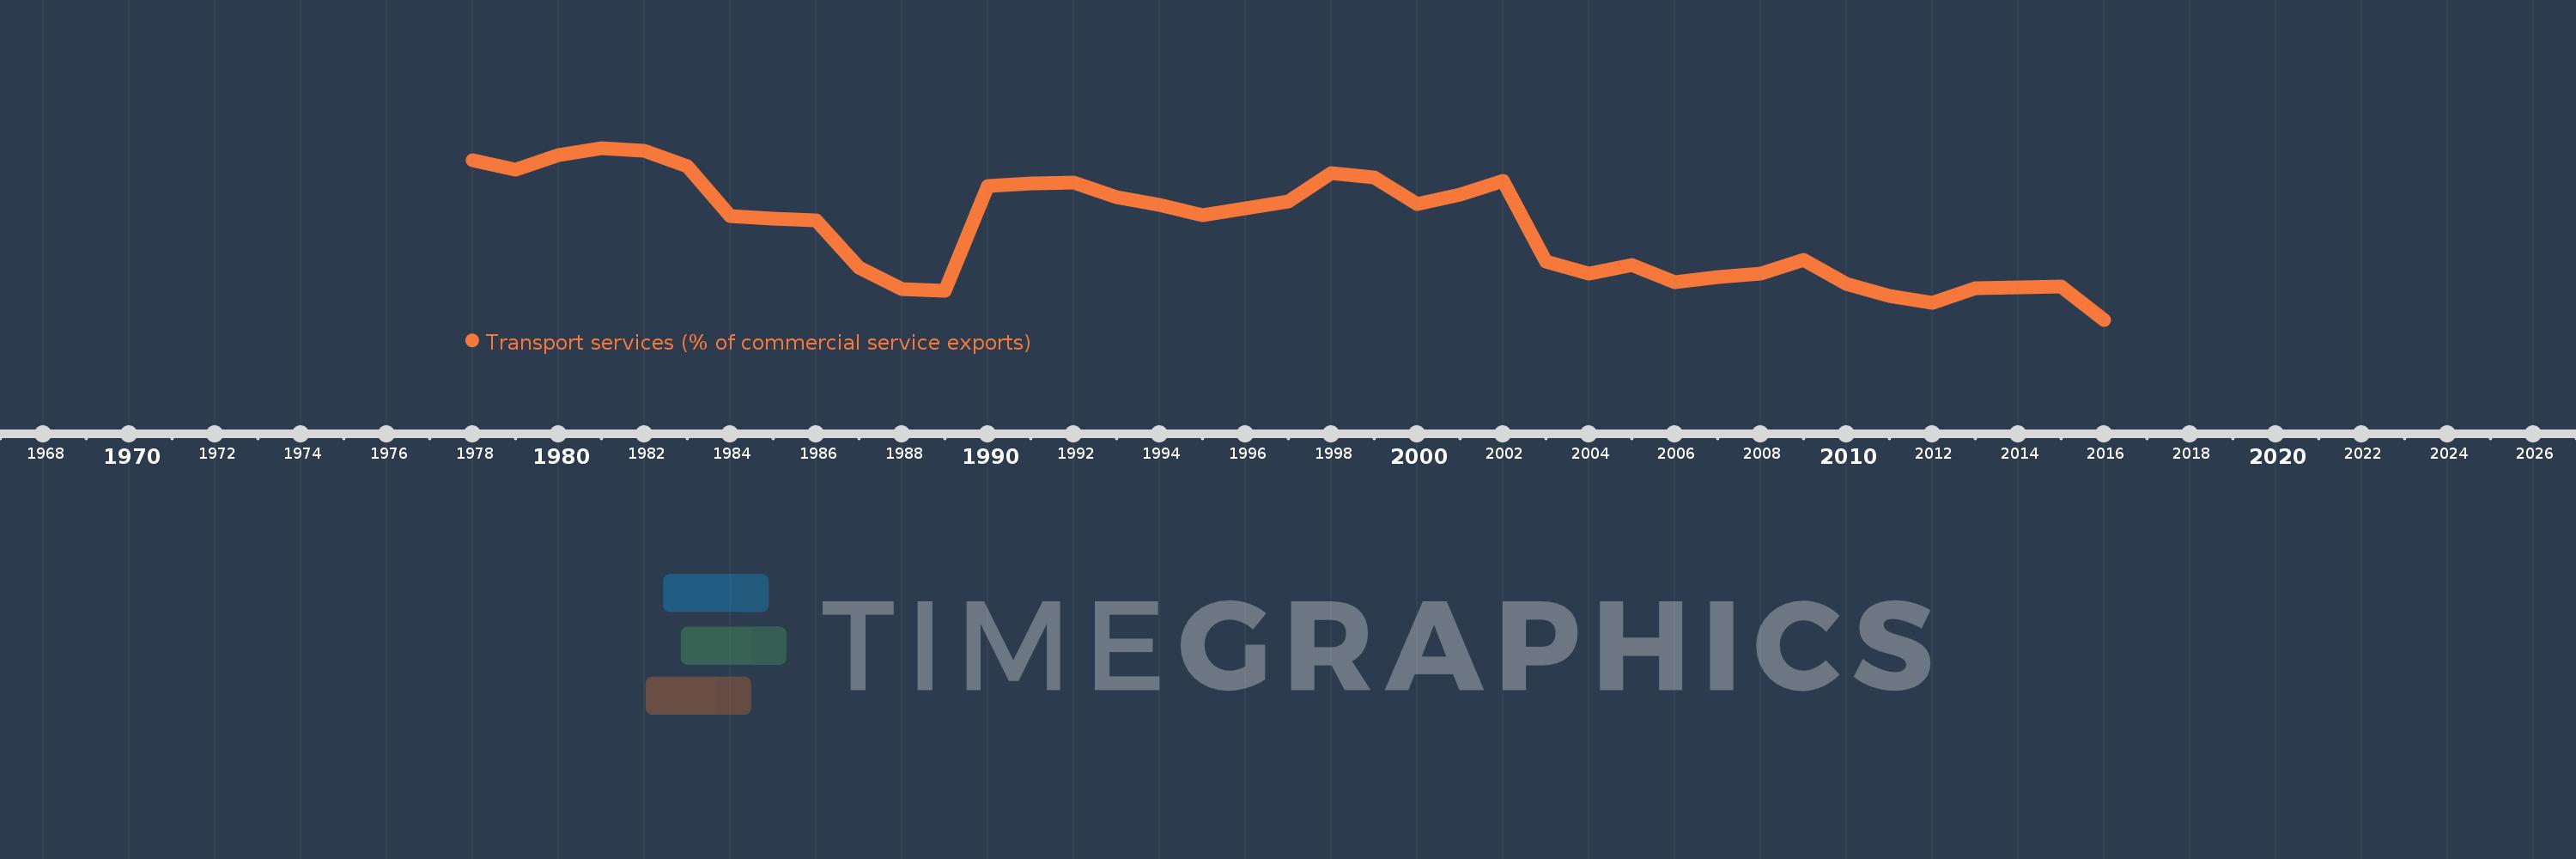
Transport services (% of commercial service exports)
2016,2015,2014,2013,2012,2011,2010,2009,2008,2007,2006,2005,2004,2003,2002,2001,2000,1999,1998,1997,1996,1995,1994,1993,1992,1991,1990,1989,1988,1987,1986,1985,1984,1983,1982,1981,1980,1979,1978
Estas estadísticas en otros países:
AfghanistanAlbaniaAlgeriaAngolaAntigua and BarbudaArab WorldArgentinaArmeniaArubaAustraliaAustriaAzerbaijanBahamas, TheBahrainBangladeshBarbadosBelarusBelgiumBelizeBeninBermudaBhutanBoliviaBosnia and HerzegovinaBotswanaBrazilBrunei DarussalamBulgariaBurkina FasoBurundiCabo VerdeCambodiaCameroonCanadaCaribbean small statesCentral African RepublicCentral Europe and the BalticsChadChileChinaColombiaComorosCongo, Dem. Rep.Congo, Rep.Costa RicaCote d'IvoireCroatiaCuracaoCyprusCzech RepublicDenmarkDjiboutiDominicaDominican RepublicEarly-demographic dividendEast Asia & PacificEast Asia & Pacific (excluding high income)East Asia & Pacific (IDA & IBRD countries)EcuadorEgypt, Arab Rep.El SalvadorEritreaEstoniaEthiopiaEuro areaEurope & Central AsiaEurope & Central Asia (excluding high income)Europe & Central Asia (IDA & IBRD countries)European UnionFaroe IslandsFijiFinlandFragile and conflict affected situationsFranceFrench PolynesiaGabonGambia, TheGeorgiaGermanyGhanaGreeceGrenadaGuatemalaGuineaGuinea-BissauGuyanaHaitiHeavily indebted poor countries (HIPC)High incomeHondurasHong Kong SAR, ChinaHungaryIBRD onlyIcelandIDA & IBRD totalIDA onlyIDA totalIndiaIndonesiaIran, Islamic Rep.IraqIrelandIsraelItalyJamaicaJapanJordanKazakhstanKenyaKiribatiKorea, Rep.KosovoKuwaitKyrgyz RepublicLao PDRLate-demographic dividendLatin America & Caribbean Latin America & Caribbean (excluding high income)Latin America & the Caribbean (IDA & IBRD countries)LatviaLeast developed countries: UN classificationLebanonLesothoLiberiaLibyaLithuaniaLow & middle incomeLow incomeLower middle incomeLuxembourgMacao SAR, ChinaMacedonia, FYRMadagascarMalawiMalaysiaMaldivesMaliMaltaMarshall IslandsMauritaniaMauritiusMexicoMicronesia, Fed. Sts.Middle East & North AfricaMiddle East & North Africa (excluding high income)Middle East & North Africa (IDA & IBRD countries)Middle incomeMoldovaMongoliaMontenegroMoroccoMozambiqueMyanmarNamibiaNepalNetherlandsNew CaledoniaNew ZealandNicaraguaNigerNigeriaNorth AmericaNorwayOECD membersOmanOther small statesPacific island small statesPakistanPalauPanamaPapua New GuineaParaguayPeruPhilippinesPolandPortugalPost-demographic dividendPre-demographic dividendQatarRomaniaRussian FederationRwandaSamoaSao Tome and PrincipeSaudi ArabiaSenegalSerbiaSeychellesSierra LeoneSingaporeSint Maarten (Dutch part)Slovak RepublicSloveniaSmall statesSolomon IslandsSouth AfricaSouth AsiaSouth Asia (IDA & IBRD)South SudanSpainSri LankaSt. Kitts and NevisSt. LuciaSt. Vincent and the GrenadinesSub-Saharan Africa Sub-Saharan Africa (excluding high income)Sub-Saharan Africa (IDA & IBRD countries)SudanSurinameSwazilandSwedenSwitzerlandSyrian Arab RepublicTajikistanTanzaniaThailandTimor-LesteTogoTongaTrinidad and TobagoTunisiaTurkeyTuvaluUgandaUkraineUnited KingdomUnited StatesUpper middle incomeUruguayVanuatuVenezuela, RBWest Bank and GazaWorldYemen, Rep.ZambiaZimbabwe línea de tiempo (timeline):
En esta escala de tiempo se presenta un gráfico de 1978 y 2016 de Switzerland. Los datos de 1977 están ausentes. El número de observaciones reales por fecha: 39.
Fuente (nombre):
Indicadores del desarrollo mundial
Fuente (organización):
International Monetary Fund, Balance of Payments Statistics Yearbook and data files.
Categorías:
Private Sector, Trade
Se ha actualizado:
23 abr 2017 año
Los indicadores de los cambios de valor en los últimos años
Mínimo:
9.975
1 ene 2016 año
Máximo:
18.754
1 ene 1981 año
A la fecha de observación
Valor
Cambio absoluto
El cambio con respecto al valor anterior
1 ene 1978 año
18.12
+18.12
0.0%
1 ene 1979 año
17.664
-0.456
-2.52%
1 ene 1980 año
18.381
+0.717
4.06%
1 ene 1981 año
18.754
+0.373
2.03%
1 ene 1982 año
18.597
-0.157
-0.83%
1 ene 1983 año
17.812
-0.785
-4.22%
1 ene 1984 año
15.258
-2.554
-14.34%
1 ene 1985 año
15.14
-0.118
-0.77%
1 ene 1986 año
15.033
-0.107
-0.71%
1 ene 1987 año
12.639
-2.395
-15.93%
1 ene 1988 año
11.55
-1.089
-8.61%
1 ene 1989 año
11.472
-0.078
-0.67%
1 ene 1990 año
16.789
+5.317
46.35%
1 ene 1991 año
16.924
+0.134
0.8%
1 ene 1992 año
16.972
+0.049
0.29%
1 ene 1993 año
16.22
-0.752
-4.43%
1 ene 1994 año
15.85
-0.37
-2.28%
1 ene 1995 año
15.314
-0.536
-3.38%
1 ene 1996 año
15.681
+0.366
2.39%
1 ene 1997 año
16.0
+0.319
2.03%
1 ene 1998 año
17.447
+1.447
9.05%
1 ene 1999 año
17.263
-0.184
-1.05%
1 ene 2000 año
15.909
-1.355
-7.85%
1 ene 2001 año
16.363
+0.454
2.85%
1 ene 2002 año
17.063
+0.701
4.28%
1 ene 2003 año
12.934
-4.13
-24.2%
1 ene 2004 año
12.319
-0.614
-4.75%
1 ene 2005 año
12.77
+0.451
3.66%
1 ene 2006 año
11.914
-0.856
-6.71%
1 ene 2007 año
12.172
+0.258
2.16%
1 ene 2008 año
12.324
+0.152
1.25%
1 ene 2009 año
13.04
+0.716
5.81%
1 ene 2010 año
11.794
-1.247
-9.56%
1 ene 2011 año
11.172
-0.622
-5.27%
1 ene 2012 año
10.84
-0.332
-2.97%
1 ene 2013 año
11.577
+0.737
6.8%
1 ene 2014 año
11.636
+0.059
0.51%
1 ene 2015 año
11.668
+0.032
0.28%
1 ene 2016 año
9.975
-1.693
-14.51%
Ranking de los países por los datos estadísticos actuales


Comentarios: