29
/es/
es
AIzaSyAYiBZKx7MnpbEhh9jyipgxe19OcubqV5w
April 1, 2024
211204
Nicaragua
NIC
true
2
1
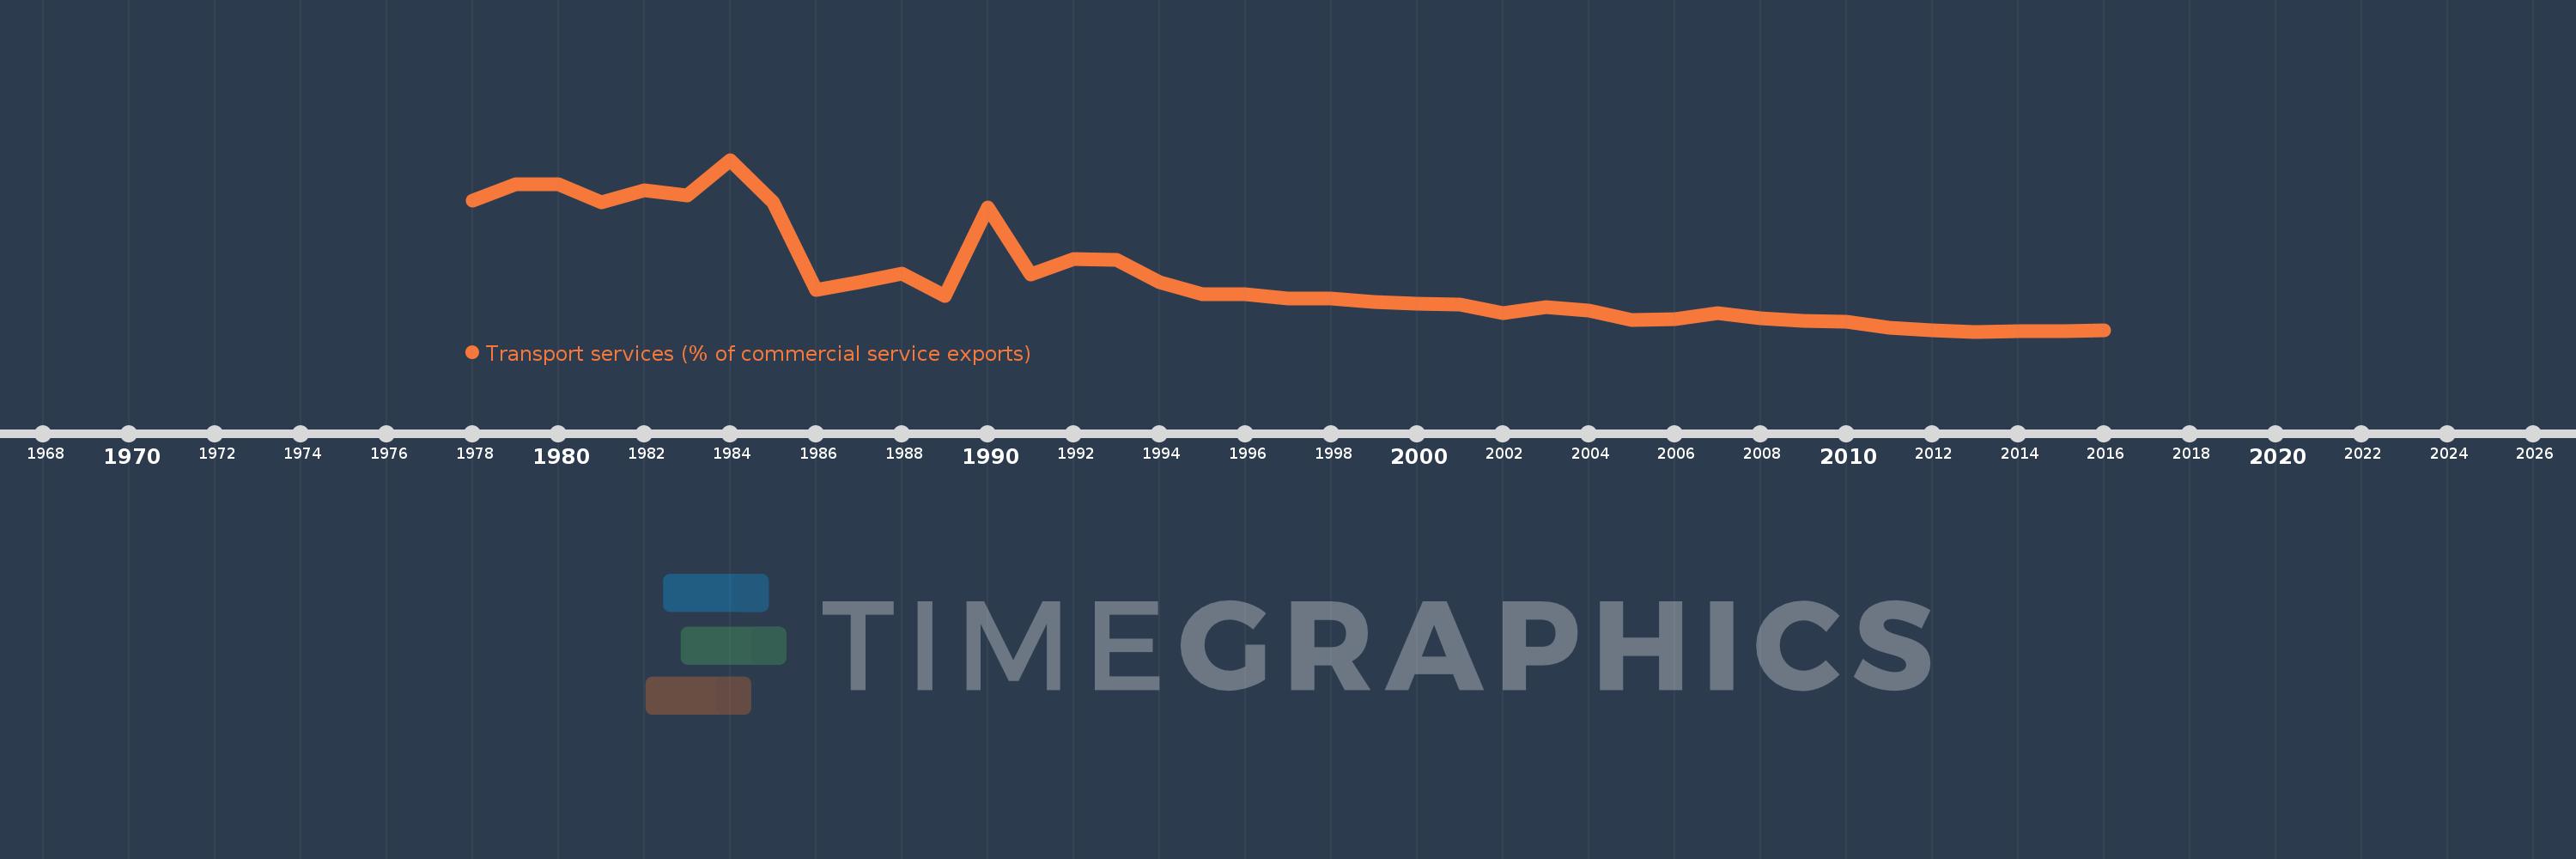
Transport services (% of commercial service exports)
2016,2015,2014,2013,2012,2011,2010,2009,2008,2007,2006,2005,2004,2003,2002,2001,2000,1999,1998,1997,1996,1995,1994,1993,1992,1991,1990,1989,1988,1987,1986,1985,1984,1983,1982,1981,1980,1979,1978
Estas estadísticas en otros países:
AfghanistanAlbaniaAlgeriaAngolaAntigua and BarbudaArab WorldArgentinaArmeniaArubaAustraliaAustriaAzerbaijanBahamas, TheBahrainBangladeshBarbadosBelarusBelgiumBelizeBeninBermudaBhutanBoliviaBosnia and HerzegovinaBotswanaBrazilBrunei DarussalamBulgariaBurkina FasoBurundiCabo VerdeCambodiaCameroonCanadaCaribbean small statesCentral African RepublicCentral Europe and the BalticsChadChileChinaColombiaComorosCongo, Dem. Rep.Congo, Rep.Costa RicaCote d'IvoireCroatiaCuracaoCyprusCzech RepublicDenmarkDjiboutiDominicaDominican RepublicEarly-demographic dividendEast Asia & PacificEast Asia & Pacific (excluding high income)East Asia & Pacific (IDA & IBRD countries)EcuadorEgypt, Arab Rep.El SalvadorEritreaEstoniaEthiopiaEuro areaEurope & Central AsiaEurope & Central Asia (excluding high income)Europe & Central Asia (IDA & IBRD countries)European UnionFaroe IslandsFijiFinlandFragile and conflict affected situationsFranceFrench PolynesiaGabonGambia, TheGeorgiaGermanyGhanaGreeceGrenadaGuatemalaGuineaGuinea-BissauGuyanaHaitiHeavily indebted poor countries (HIPC)High incomeHondurasHong Kong SAR, ChinaHungaryIBRD onlyIcelandIDA & IBRD totalIDA onlyIDA totalIndiaIndonesiaIran, Islamic Rep.IraqIrelandIsraelItalyJamaicaJapanJordanKazakhstanKenyaKiribatiKorea, Rep.KosovoKuwaitKyrgyz RepublicLao PDRLate-demographic dividendLatin America & Caribbean Latin America & Caribbean (excluding high income)Latin America & the Caribbean (IDA & IBRD countries)LatviaLeast developed countries: UN classificationLebanonLesothoLiberiaLibyaLithuaniaLow & middle incomeLow incomeLower middle incomeLuxembourgMacao SAR, ChinaMacedonia, FYRMadagascarMalawiMalaysiaMaldivesMaliMaltaMarshall IslandsMauritaniaMauritiusMexicoMicronesia, Fed. Sts.Middle East & North AfricaMiddle East & North Africa (excluding high income)Middle East & North Africa (IDA & IBRD countries)Middle incomeMoldovaMongoliaMontenegroMoroccoMozambiqueMyanmarNamibiaNepalNetherlandsNew CaledoniaNew ZealandNicaraguaNigerNigeriaNorth AmericaNorwayOECD membersOmanOther small statesPacific island small statesPakistanPalauPanamaPapua New GuineaParaguayPeruPhilippinesPolandPortugalPost-demographic dividendPre-demographic dividendQatarRomaniaRussian FederationRwandaSamoaSao Tome and PrincipeSaudi ArabiaSenegalSerbiaSeychellesSierra LeoneSingaporeSint Maarten (Dutch part)Slovak RepublicSloveniaSmall statesSolomon IslandsSouth AfricaSouth AsiaSouth Asia (IDA & IBRD)South SudanSpainSri LankaSt. Kitts and NevisSt. LuciaSt. Vincent and the GrenadinesSub-Saharan Africa Sub-Saharan Africa (excluding high income)Sub-Saharan Africa (IDA & IBRD countries)SudanSurinameSwazilandSwedenSwitzerlandSyrian Arab RepublicTajikistanTanzaniaThailandTimor-LesteTogoTongaTrinidad and TobagoTunisiaTurkeyTuvaluUgandaUkraineUnited KingdomUnited StatesUpper middle incomeUruguayVanuatuVenezuela, RBWest Bank and GazaWorldYemen, Rep.ZambiaZimbabwe línea de tiempo (timeline):
En esta escala de tiempo se presenta un gráfico de 1978 y 2016 de Nicaragua. Los datos de 1977 están ausentes. El número de observaciones reales por fecha: 39.
Fuente (nombre):
Indicadores del desarrollo mundial
Fuente (organización):
International Monetary Fund, Balance of Payments Statistics Yearbook and data files.
Categorías:
Private Sector, Trade
Se ha actualizado:
23 abr 2017 año
Los indicadores de los cambios de valor en los últimos años
Mínimo:
3.492
1 ene 2013 año
Máximo:
50.562
1 ene 1984 año
A la fecha de observación
Valor
Cambio absoluto
El cambio con respecto al valor anterior
1 ene 1978 año
39.427
+39.427
0.0%
1 ene 1979 año
43.799
+4.372
11.09%
1 ene 1980 año
43.927
+0.128
0.29%
1 ene 1981 año
39.024
-4.903
-11.16%
1 ene 1982 año
42.271
+3.246
8.32%
1 ene 1983 año
40.761
-1.51
-3.57%
1 ene 1984 año
50.562
+9.801
24.04%
1 ene 1985 año
38.889
-11.673
-23.09%
1 ene 1986 año
15.013
-23.876
-61.4%
1 ene 1987 año
16.949
+1.936
12.9%
1 ene 1988 año
19.322
+2.373
14.0%
1 ene 1989 año
13.369
-5.953
-30.81%
1 ene 1990 año
37.576
+24.207
181.07%
1 ene 1991 año
19.186
-18.39
-48.94%
1 ene 1992 año
23.307
+4.121
21.48%
1 ene 1993 año
23.123
-0.184
-0.79%
1 ene 1994 año
17.039
-6.083
-26.31%
1 ene 1995 año
13.726
-3.313
-19.44%
1 ene 1996 año
13.746
+0.02
0.15%
1 ene 1997 año
12.486
-1.26
-9.16%
1 ene 1998 año
12.585
+0.099
0.79%
1 ene 1999 año
11.513
-1.072
-8.52%
1 ene 2000 año
11.242
-0.272
-2.36%
1 ene 2001 año
11.008
-0.234
-2.08%
1 ene 2002 año
8.446
-2.562
-23.27%
1 ene 2003 año
10.122
+1.676
19.85%
1 ene 2004 año
9.304
-0.819
-8.09%
1 ene 2005 año
6.745
-2.559
-27.5%
1 ene 2006 año
6.85
+0.105
1.56%
1 ene 2007 año
8.567
+1.716
25.06%
1 ene 2008 año
7.035
-1.531
-17.88%
1 ene 2009 año
6.403
-0.632
-8.98%
1 ene 2010 año
6.096
-0.307
-4.79%
1 ene 2011 año
4.609
-1.488
-24.4%
1 ene 2012 año
3.952
-0.657
-14.26%
1 ene 2013 año
3.492
-0.459
-11.63%
1 ene 2014 año
3.541
+0.049
1.41%
1 ene 2015 año
3.548
+0.006
0.18%
1 ene 2016 año
3.92
+0.372
10.48%
Ranking de los países por los datos estadísticos actuales


Comentarios: