29
/es/
es
AIzaSyAYiBZKx7MnpbEhh9jyipgxe19OcubqV5w
April 1, 2024
214894
Norway
NOR
true
2
1
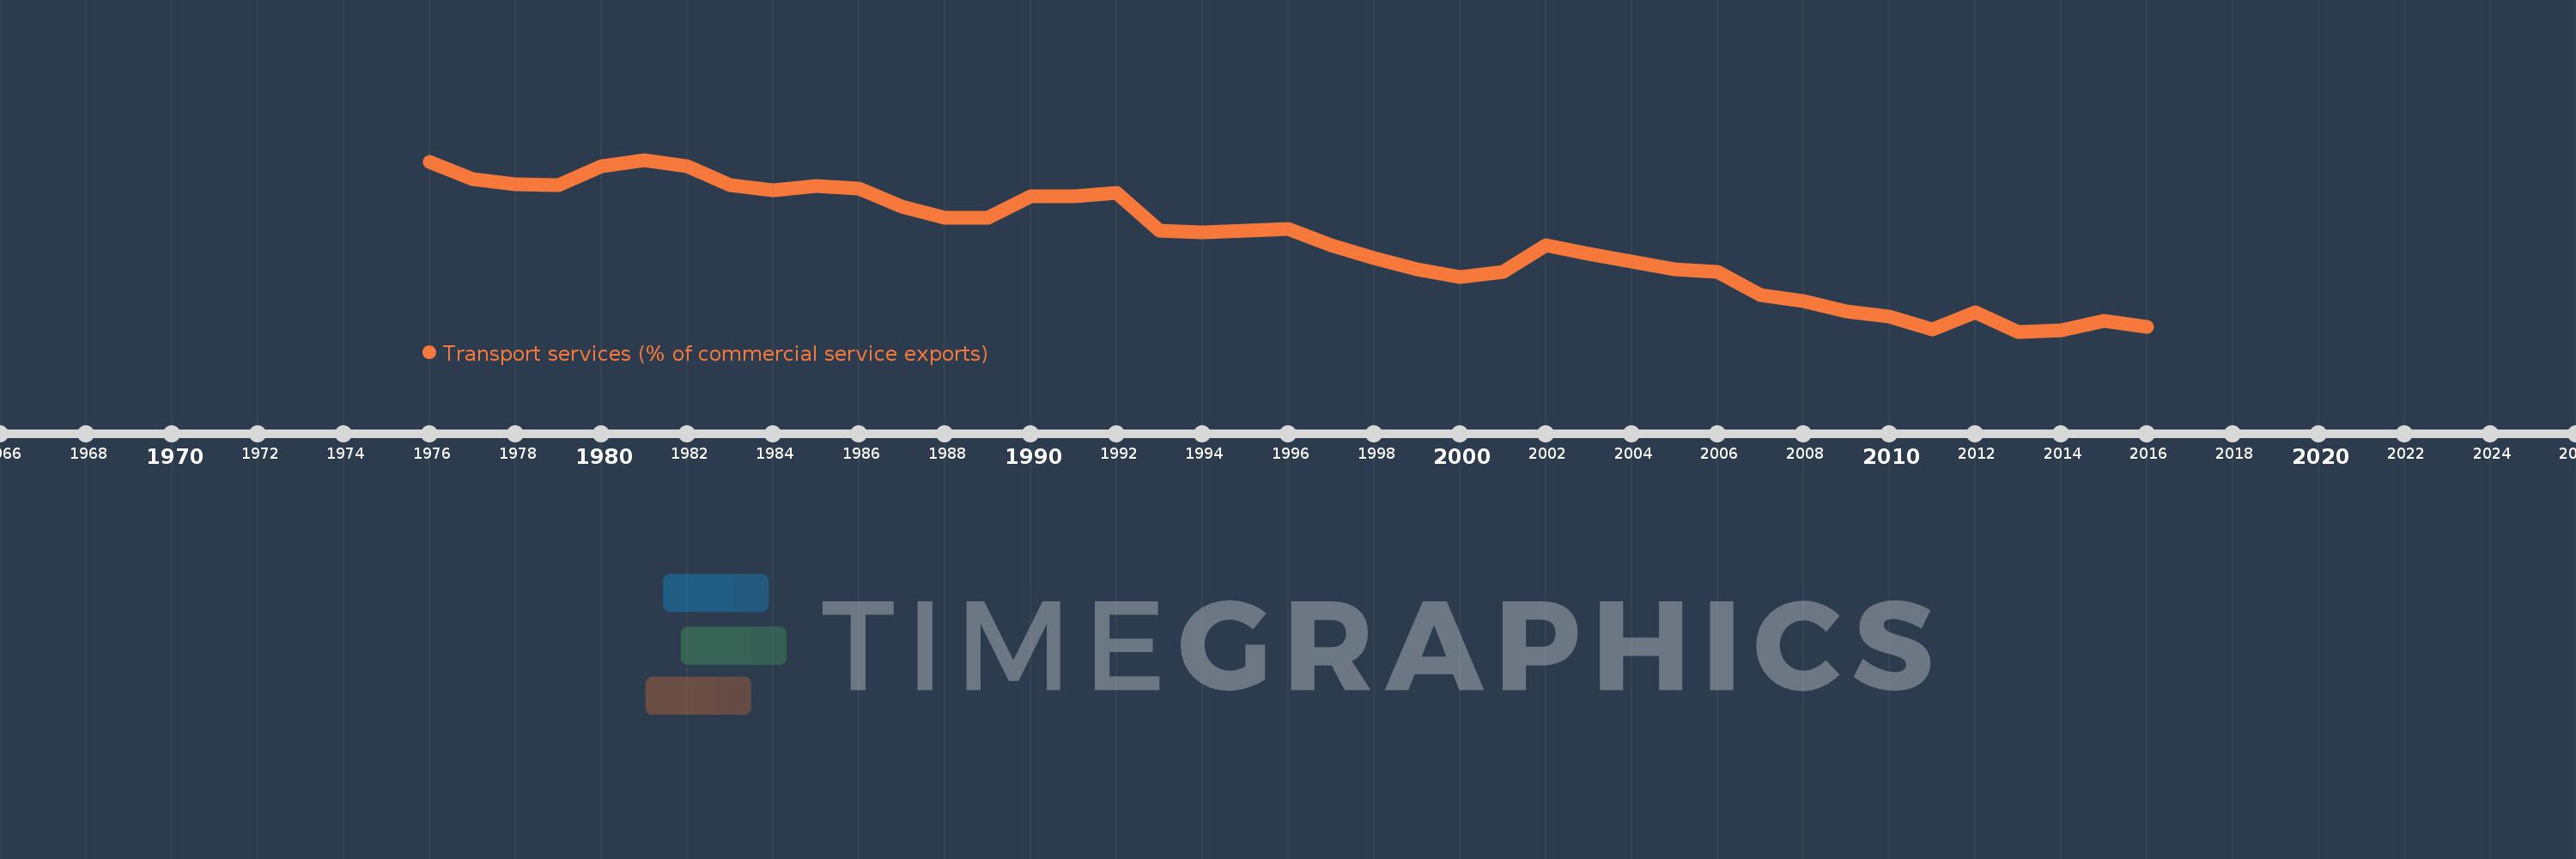
Transport services (% of commercial service exports)
2016,2015,2014,2013,2012,2011,2010,2009,2008,2007,2006,2005,2004,2003,2002,2001,2000,1999,1998,1997,1996,1995,1994,1993,1992,1991,1990,1989,1988,1987,1986,1985,1984,1983,1982,1981,1980,1979,1978,1977,1976
Estas estadísticas en otros países:
AfghanistanAlbaniaAlgeriaAngolaAntigua and BarbudaArab WorldArgentinaArmeniaArubaAustraliaAustriaAzerbaijanBahamas, TheBahrainBangladeshBarbadosBelarusBelgiumBelizeBeninBermudaBhutanBoliviaBosnia and HerzegovinaBotswanaBrazilBrunei DarussalamBulgariaBurkina FasoBurundiCabo VerdeCambodiaCameroonCanadaCaribbean small statesCentral African RepublicCentral Europe and the BalticsChadChileChinaColombiaComorosCongo, Dem. Rep.Congo, Rep.Costa RicaCote d'IvoireCroatiaCuracaoCyprusCzech RepublicDenmarkDjiboutiDominicaDominican RepublicEarly-demographic dividendEast Asia & PacificEast Asia & Pacific (excluding high income)East Asia & Pacific (IDA & IBRD countries)EcuadorEgypt, Arab Rep.El SalvadorEritreaEstoniaEthiopiaEuro areaEurope & Central AsiaEurope & Central Asia (excluding high income)Europe & Central Asia (IDA & IBRD countries)European UnionFaroe IslandsFijiFinlandFragile and conflict affected situationsFranceFrench PolynesiaGabonGambia, TheGeorgiaGermanyGhanaGreeceGrenadaGuatemalaGuineaGuinea-BissauGuyanaHaitiHeavily indebted poor countries (HIPC)High incomeHondurasHong Kong SAR, ChinaHungaryIBRD onlyIcelandIDA & IBRD totalIDA onlyIDA totalIndiaIndonesiaIran, Islamic Rep.IraqIrelandIsraelItalyJamaicaJapanJordanKazakhstanKenyaKiribatiKorea, Rep.KosovoKuwaitKyrgyz RepublicLao PDRLate-demographic dividendLatin America & Caribbean Latin America & Caribbean (excluding high income)Latin America & the Caribbean (IDA & IBRD countries)LatviaLeast developed countries: UN classificationLebanonLesothoLiberiaLibyaLithuaniaLow & middle incomeLow incomeLower middle incomeLuxembourgMacao SAR, ChinaMacedonia, FYRMadagascarMalawiMalaysiaMaldivesMaliMaltaMarshall IslandsMauritaniaMauritiusMexicoMicronesia, Fed. Sts.Middle East & North AfricaMiddle East & North Africa (excluding high income)Middle East & North Africa (IDA & IBRD countries)Middle incomeMoldovaMongoliaMontenegroMoroccoMozambiqueMyanmarNamibiaNepalNetherlandsNew CaledoniaNew ZealandNicaraguaNigerNigeriaNorth AmericaNorwayOECD membersOmanOther small statesPacific island small statesPakistanPalauPanamaPapua New GuineaParaguayPeruPhilippinesPolandPortugalPost-demographic dividendPre-demographic dividendQatarRomaniaRussian FederationRwandaSamoaSao Tome and PrincipeSaudi ArabiaSenegalSerbiaSeychellesSierra LeoneSingaporeSint Maarten (Dutch part)Slovak RepublicSloveniaSmall statesSolomon IslandsSouth AfricaSouth AsiaSouth Asia (IDA & IBRD)South SudanSpainSri LankaSt. Kitts and NevisSt. LuciaSt. Vincent and the GrenadinesSub-Saharan Africa Sub-Saharan Africa (excluding high income)Sub-Saharan Africa (IDA & IBRD countries)SudanSurinameSwazilandSwedenSwitzerlandSyrian Arab RepublicTajikistanTanzaniaThailandTimor-LesteTogoTongaTrinidad and TobagoTunisiaTurkeyTuvaluUgandaUkraineUnited KingdomUnited StatesUpper middle incomeUruguayVanuatuVenezuela, RBWest Bank and GazaWorldYemen, Rep.ZambiaZimbabwe línea de tiempo (timeline):
En esta escala de tiempo se presenta un gráfico de 1976 y 2016 de Norway. Los datos de 1975 están ausentes. El número de observaciones reales por fecha: 41.
Fuente (nombre):
Indicadores del desarrollo mundial
Fuente (organización):
International Monetary Fund, Balance of Payments Statistics Yearbook and data files.
Categorías:
Private Sector, Trade
Se ha actualizado:
23 abr 2017 año
Los indicadores de los cambios de valor en los últimos años
Mínimo:
43.979
1 ene 2013 año
Máximo:
75.284
1 ene 1981 año
A la fecha de observación
Valor
Cambio absoluto
El cambio con respecto al valor anterior
1 ene 1976 año
74.895
+74.895
0.0%
1 ene 1977 año
71.726
-3.17
-4.23%
1 ene 1978 año
70.894
-0.832
-1.16%
1 ene 1979 año
70.744
-0.15
-0.21%
1 ene 1980 año
74.17
+3.427
4.84%
1 ene 1981 año
75.284
+1.114
1.5%
1 ene 1982 año
74.036
-1.248
-1.66%
1 ene 1983 año
70.716
-3.32
-4.48%
1 ene 1984 año
69.665
-1.051
-1.49%
1 ene 1985 año
70.533
+0.868
1.25%
1 ene 1986 año
70.104
-0.429
-0.61%
1 ene 1987 año
66.815
-3.289
-4.69%
1 ene 1988 año
64.703
-2.112
-3.16%
1 ene 1989 año
64.784
+0.081
0.12%
1 ene 1990 año
68.6
+3.816
5.89%
1 ene 1991 año
68.692
+0.093
0.14%
1 ene 1992 año
69.263
+0.571
0.83%
1 ene 1993 año
62.378
-6.885
-9.94%
1 ene 1994 año
61.991
-0.388
-0.62%
1 ene 1995 año
62.398
+0.407
0.66%
1 ene 1996 año
62.757
+0.359
0.57%
1 ene 1997 año
59.744
-3.013
-4.8%
1 ene 1998 año
57.401
-2.343
-3.92%
1 ene 1999 año
55.36
-2.041
-3.56%
1 ene 2000 año
53.921
-1.439
-2.6%
1 ene 2001 año
54.845
+0.924
1.71%
1 ene 2002 año
59.75
+4.905
8.94%
1 ene 2003 año
58.177
-1.573
-2.63%
1 ene 2004 año
56.787
-1.39
-2.39%
1 ene 2005 año
55.266
-1.521
-2.68%
1 ene 2006 año
54.906
-0.36
-0.65%
1 ene 2007 año
50.687
-4.219
-7.68%
1 ene 2008 año
49.571
-1.116
-2.2%
1 ene 2009 año
47.628
-1.943
-3.92%
1 ene 2010 año
46.772
-0.856
-1.8%
1 ene 2011 año
44.317
-2.455
-5.25%
1 ene 2012 año
47.553
+3.236
7.3%
1 ene 2013 año
43.979
-3.574
-7.51%
1 ene 2014 año
44.149
+0.169
0.39%
1 ene 2015 año
45.972
+1.823
4.13%
1 ene 2016 año
44.896
-1.076
-2.34%
Ranking de los países por los datos estadísticos actuales


Comentarios: