29
/es/
es
AIzaSyAYiBZKx7MnpbEhh9jyipgxe19OcubqV5w
April 1, 2024
168328
Kenya
KEN
true
2
1
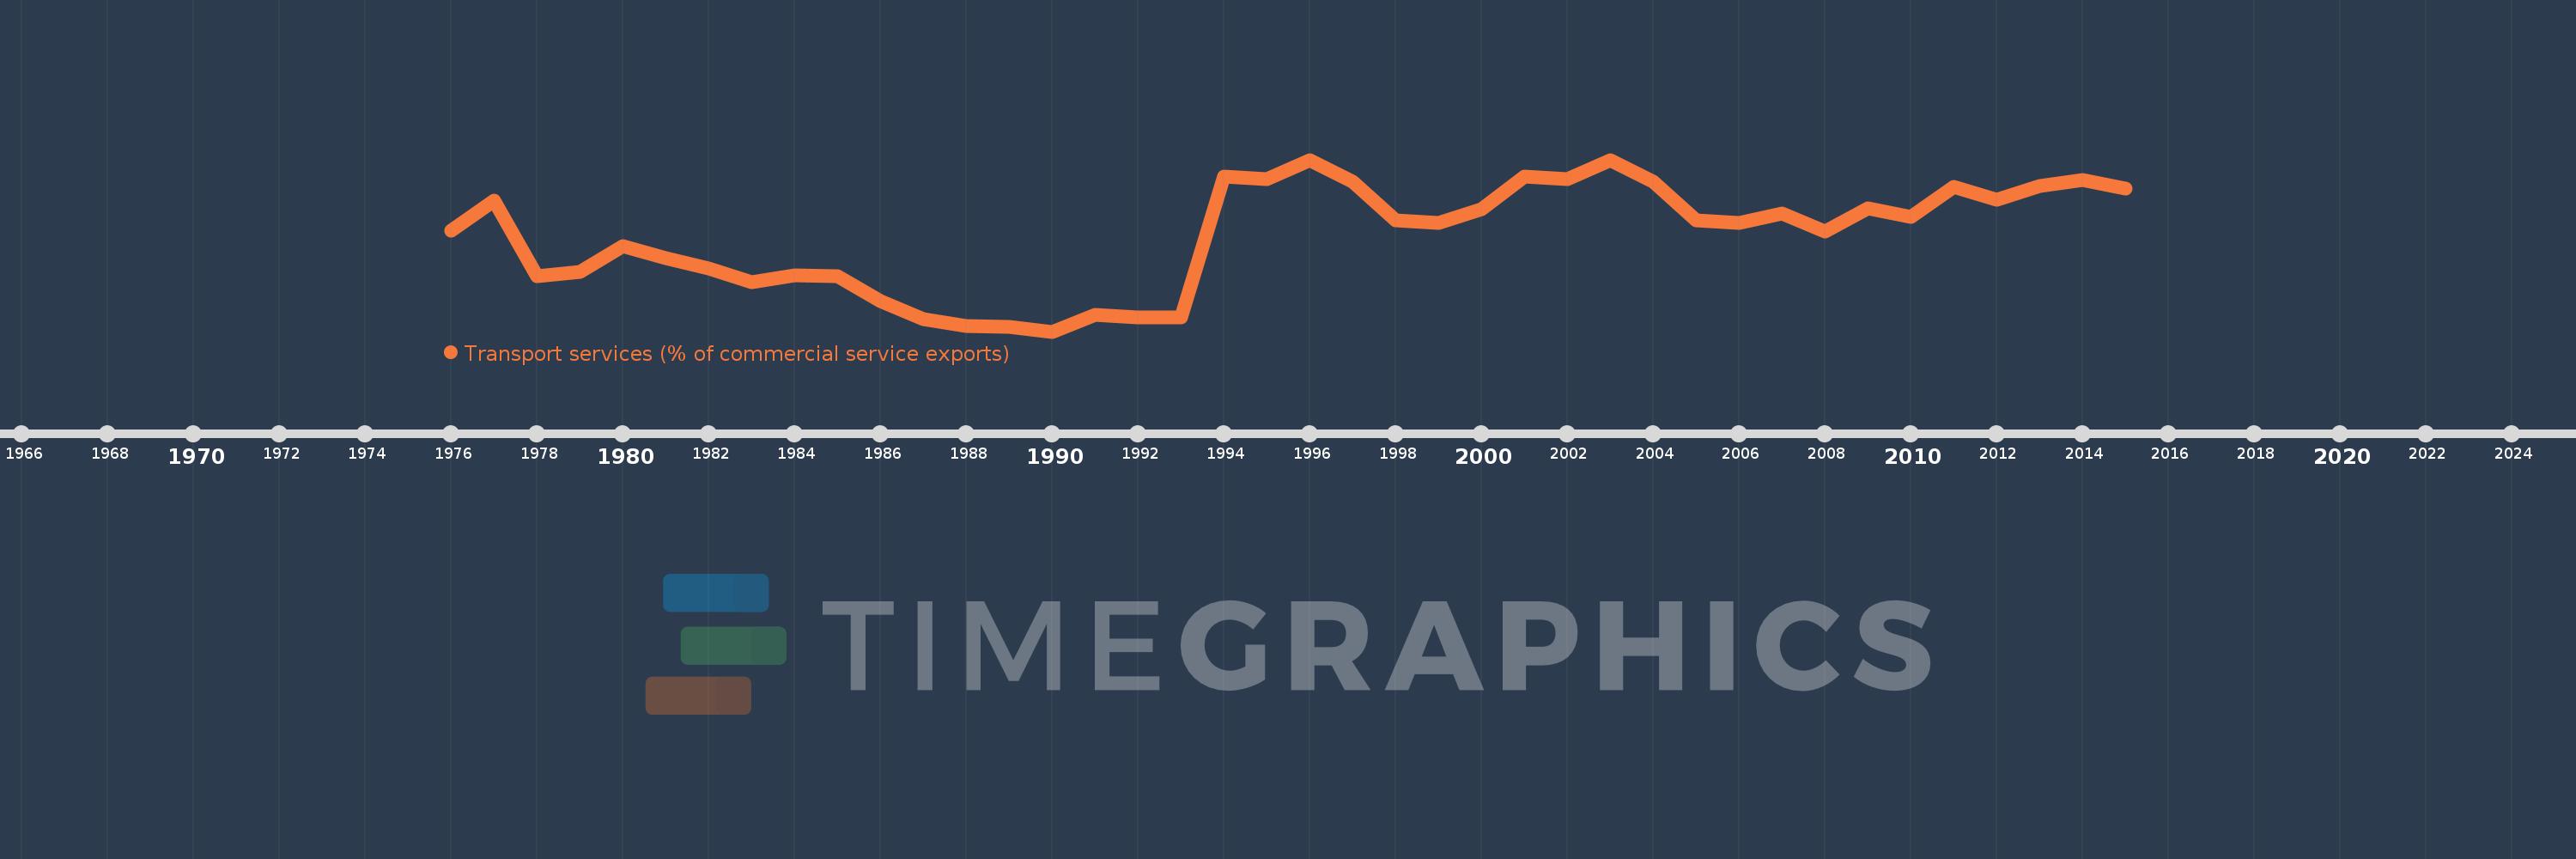
Transport services (% of commercial service exports)
2015,2014,2013,2012,2011,2010,2009,2008,2007,2006,2005,2004,2003,2002,2001,2000,1999,1998,1997,1996,1995,1994,1993,1992,1991,1990,1989,1988,1987,1986,1985,1984,1983,1982,1981,1980,1979,1978,1977,1976
Estas estadísticas en otros países:
AfghanistanAlbaniaAlgeriaAngolaAntigua and BarbudaArab WorldArgentinaArmeniaArubaAustraliaAustriaAzerbaijanBahamas, TheBahrainBangladeshBarbadosBelarusBelgiumBelizeBeninBermudaBhutanBoliviaBosnia and HerzegovinaBotswanaBrazilBrunei DarussalamBulgariaBurkina FasoBurundiCabo VerdeCambodiaCameroonCanadaCaribbean small statesCentral African RepublicCentral Europe and the BalticsChadChileChinaColombiaComorosCongo, Dem. Rep.Congo, Rep.Costa RicaCote d'IvoireCroatiaCuracaoCyprusCzech RepublicDenmarkDjiboutiDominicaDominican RepublicEarly-demographic dividendEast Asia & PacificEast Asia & Pacific (excluding high income)East Asia & Pacific (IDA & IBRD countries)EcuadorEgypt, Arab Rep.El SalvadorEritreaEstoniaEthiopiaEuro areaEurope & Central AsiaEurope & Central Asia (excluding high income)Europe & Central Asia (IDA & IBRD countries)European UnionFaroe IslandsFijiFinlandFragile and conflict affected situationsFranceFrench PolynesiaGabonGambia, TheGeorgiaGermanyGhanaGreeceGrenadaGuatemalaGuineaGuinea-BissauGuyanaHaitiHeavily indebted poor countries (HIPC)High incomeHondurasHong Kong SAR, ChinaHungaryIBRD onlyIcelandIDA & IBRD totalIDA onlyIDA totalIndiaIndonesiaIran, Islamic Rep.IraqIrelandIsraelItalyJamaicaJapanJordanKazakhstanKenyaKiribatiKorea, Rep.KosovoKuwaitKyrgyz RepublicLao PDRLate-demographic dividendLatin America & Caribbean Latin America & Caribbean (excluding high income)Latin America & the Caribbean (IDA & IBRD countries)LatviaLeast developed countries: UN classificationLebanonLesothoLiberiaLibyaLithuaniaLow & middle incomeLow incomeLower middle incomeLuxembourgMacao SAR, ChinaMacedonia, FYRMadagascarMalawiMalaysiaMaldivesMaliMaltaMarshall IslandsMauritaniaMauritiusMexicoMicronesia, Fed. Sts.Middle East & North AfricaMiddle East & North Africa (excluding high income)Middle East & North Africa (IDA & IBRD countries)Middle incomeMoldovaMongoliaMontenegroMoroccoMozambiqueMyanmarNamibiaNepalNetherlandsNew CaledoniaNew ZealandNicaraguaNigerNigeriaNorth AmericaNorwayOECD membersOmanOther small statesPacific island small statesPakistanPalauPanamaPapua New GuineaParaguayPeruPhilippinesPolandPortugalPost-demographic dividendPre-demographic dividendQatarRomaniaRussian FederationRwandaSamoaSao Tome and PrincipeSaudi ArabiaSenegalSerbiaSeychellesSierra LeoneSingaporeSint Maarten (Dutch part)Slovak RepublicSloveniaSmall statesSolomon IslandsSouth AfricaSouth AsiaSouth Asia (IDA & IBRD)South SudanSpainSri LankaSt. Kitts and NevisSt. LuciaSt. Vincent and the GrenadinesSub-Saharan Africa Sub-Saharan Africa (excluding high income)Sub-Saharan Africa (IDA & IBRD countries)SudanSurinameSwazilandSwedenSwitzerlandSyrian Arab RepublicTajikistanTanzaniaThailandTimor-LesteTogoTongaTrinidad and TobagoTunisiaTurkeyTuvaluUgandaUkraineUnited KingdomUnited StatesUpper middle incomeUruguayVanuatuVenezuela, RBWest Bank and GazaWorldYemen, Rep.ZambiaZimbabwe línea de tiempo (timeline):
En esta escala de tiempo se presenta un gráfico de 1976 y 2015 de Kenya. Los datos de 1975 están ausentes. El número de observaciones reales por fecha: 40.
Fuente (nombre):
Indicadores del desarrollo mundial
Fuente (organización):
International Monetary Fund, Balance of Payments Statistics Yearbook and data files.
Categorías:
Private Sector, Trade
Se ha actualizado:
23 abr 2017 año
Los indicadores de los cambios de valor en los últimos años
Mínimo:
29.105
1 ene 1990 año
Máximo:
59.494
1 ene 2003 año
A la fecha de observación
Valor
Cambio absoluto
El cambio con respecto al valor anterior
1 ene 1976 año
46.977
+46.977
0.0%
1 ene 1977 año
52.266
+5.289
11.26%
1 ene 1978 año
38.891
-13.375
-25.59%
1 ene 1979 año
39.653
+0.762
1.96%
1 ene 1980 año
44.173
+4.52
11.4%
1 ene 1981 año
42.115
-2.058
-4.66%
1 ene 1982 año
40.296
-1.819
-4.32%
1 ene 1983 año
37.846
-2.449
-6.08%
1 ene 1984 año
39.121
+1.275
3.37%
1 ene 1985 año
38.89
-0.232
-0.59%
1 ene 1986 año
34.546
-4.343
-11.17%
1 ene 1987 año
31.281
-3.265
-9.45%
1 ene 1988 año
30.039
-1.242
-3.97%
1 ene 1989 año
29.977
-0.062
-0.21%
1 ene 1990 año
29.105
-0.873
-2.91%
1 ene 1991 año
32.047
+2.942
10.11%
1 ene 1992 año
31.623
-0.424
-1.32%
1 ene 1993 año
31.635
+0.013
0.04%
1 ene 1994 año
56.594
+24.958
78.89%
1 ene 1995 año
56.032
-0.561
-0.99%
1 ene 1996 año
59.494
+3.462
6.18%
1 ene 1997 año
55.69
-3.804
-6.39%
1 ene 1998 año
48.801
-6.889
-12.37%
1 ene 1999 año
48.363
-0.438
-0.9%
1 ene 2000 año
50.763
+2.4
4.96%
1 ene 2001 año
56.594
+5.83
11.49%
1 ene 2002 año
56.032
-0.561
-0.99%
1 ene 2003 año
59.494
+3.462
6.18%
1 ene 2004 año
55.69
-3.804
-6.39%
1 ene 2005 año
48.801
-6.889
-12.37%
1 ene 2006 año
48.359
-0.442
-0.91%
1 ene 2007 año
49.979
+1.62
3.35%
1 ene 2008 año
46.777
-3.202
-6.41%
1 ene 2009 año
50.845
+4.068
8.7%
1 ene 2010 año
49.348
-1.497
-2.94%
1 ene 2011 año
54.7
+5.352
10.85%
1 ene 2012 año
52.421
-2.279
-4.17%
1 ene 2013 año
54.885
+2.463
4.7%
1 ene 2014 año
55.929
+1.045
1.9%
1 ene 2015 año
54.435
-1.494
-2.67%
Ranking de los países por los datos estadísticos actuales


Comentarios: