29
/es/
es
AIzaSyAYiBZKx7MnpbEhh9jyipgxe19OcubqV5w
April 1, 2024
240286
Singapore
SGP
true
2
1
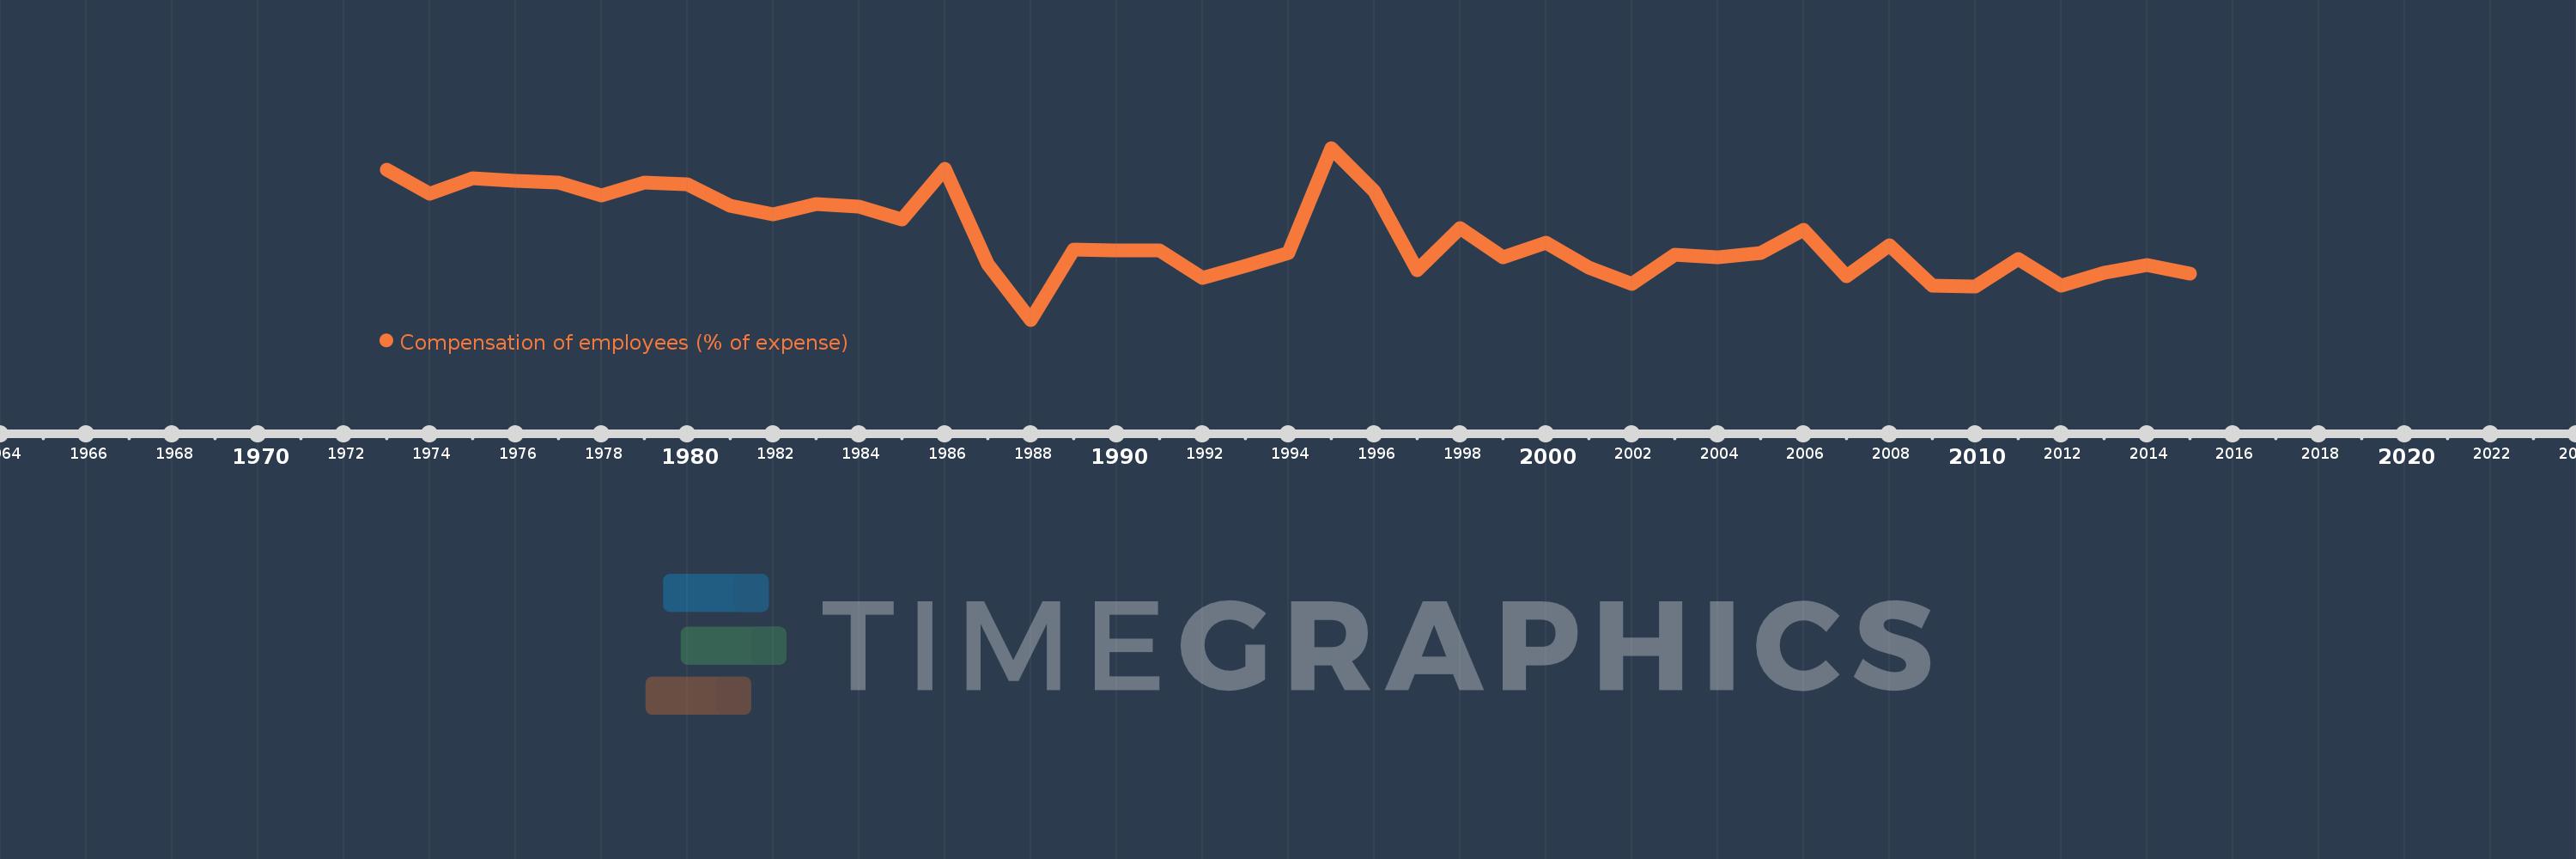
Compensation of employees (% of expense)
2015,2014,2013,2012,2011,2010,2009,2008,2007,2006,2005,2004,2003,2002,2001,2000,1999,1998,1997,1996,1995,1994,1993,1992,1991,1990,1989,1988,1987,1986,1985,1984,1983,1982,1981,1980,1979,1978,1977,1976,1975,1974,1973
Estas estadísticas en otros países:
AfghanistanAlbaniaAlgeriaAngolaAntigua and BarbudaArab WorldArmeniaAustraliaAustriaAzerbaijanBahamas, TheBahrainBangladeshBarbadosBelarusBelgiumBelizeBeninBhutanBoliviaBosnia and HerzegovinaBotswanaBrazilBulgariaBurkina FasoBurundiCabo VerdeCambodiaCanadaCaribbean small statesCentral African RepublicCentral Europe and the BalticsChileColombiaCongo, Dem. Rep.Congo, Rep.Costa RicaCote d'IvoireCroatiaCyprusCzech RepublicDenmarkDominicaDominican RepublicEarly-demographic dividendEast Asia & PacificEast Asia & Pacific (excluding high income)East Asia & Pacific (IDA & IBRD countries)Egypt, Arab Rep.El SalvadorEquatorial GuineaEstoniaEthiopiaEuro areaEurope & Central AsiaEurope & Central Asia (excluding high income)Europe & Central Asia (IDA & IBRD countries)European UnionFijiFinlandFranceGambia, TheGeorgiaGermanyGhanaGreeceGrenadaGuatemalaHeavily indebted poor countries (HIPC)High incomeHondurasHong Kong SAR, ChinaHungaryIBRD onlyIcelandIDA & IBRD totalIDA blendIDA onlyIDA totalIndiaIndonesiaIran, Islamic Rep.IraqIrelandIsraelItalyJamaicaJapanJordanKazakhstanKenyaKiribatiKorea, Rep.KuwaitKyrgyz RepublicLao PDRLate-demographic dividendLatin America & Caribbean Latin America & Caribbean (excluding high income)Latin America & the Caribbean (IDA & IBRD countries)LatviaLeast developed countries: UN classificationLebanonLesothoLiberiaLithuaniaLow & middle incomeLow incomeLower middle incomeLuxembourgMacao SAR, ChinaMacedonia, FYRMadagascarMalawiMalaysiaMaldivesMaliMaltaMauritiusMexicoMicronesia, Fed. Sts.Middle East & North AfricaMiddle East & North Africa (excluding high income)Middle East & North Africa (IDA & IBRD countries)Middle incomeMoldovaMongoliaMoroccoMozambiqueNamibiaNepalNetherlandsNew ZealandNicaraguaNigeriaNorth AmericaNorwayOECD membersOmanOther small statesPakistanPanamaPapua New GuineaParaguayPeruPhilippinesPolandPortugalPost-demographic dividendPre-demographic dividendQatarRomaniaRussian FederationRwandaSamoaSan MarinoSao Tome and PrincipeSenegalSerbiaSeychellesSierra LeoneSingaporeSlovak RepublicSloveniaSmall statesSolomon IslandsSouth AfricaSouth AsiaSouth Asia (IDA & IBRD)SpainSri LankaSt. Kitts and NevisSt. LuciaSub-Saharan Africa Sub-Saharan Africa (excluding high income)Sub-Saharan Africa (IDA & IBRD countries)SurinameSwazilandSwedenSwitzerlandSyrian Arab RepublicTajikistanTanzaniaThailandTimor-LesteTogoTrinidad and TobagoTunisiaTurkeyUgandaUkraineUnited Arab EmiratesUnited KingdomUnited StatesUpper middle incomeUruguayVanuatuVenezuela, RBWest Bank and GazaWorldYemen, Rep.ZambiaZimbabwe línea de tiempo (timeline):
En esta escala de tiempo se presenta un gráfico de 1973 y 2015 de Singapore. Los datos de 1972 están ausentes. El número de observaciones reales por fecha: 43.
Fuente (nombre):
Indicadores del desarrollo mundial
Fuente (organización):
International Monetary Fund, Government Finance Statistics Yearbook and data files.
Categorías:
Public Sector
Se ha actualizado:
23 abr 2017 año
Los indicadores de los cambios de valor en los últimos años
Mínimo:
22.992
1 ene 1988 año
Máximo:
43.982
1 ene 1995 año
A la fecha de observación
Valor
Cambio absoluto
El cambio con respecto al valor anterior
1 ene 1973 año
41.285
+41.285
0.0%
1 ene 1974 año
38.429
-2.856
-6.92%
1 ene 1975 año
40.295
+1.866
4.85%
1 ene 1976 año
40.0
-0.295
-0.73%
1 ene 1977 año
39.716
-0.284
-0.71%
1 ene 1978 año
38.227
-1.489
-3.75%
1 ene 1979 año
39.773
+1.546
4.04%
1 ene 1980 año
39.521
-0.251
-0.63%
1 ene 1981 año
36.882
-2.639
-6.68%
1 ene 1982 año
35.855
-1.027
-2.78%
1 ene 1983 año
37.093
+1.238
3.45%
1 ene 1984 año
36.861
-0.232
-0.62%
1 ene 1985 año
35.204
-1.657
-4.5%
1 ene 1986 año
41.439
+6.235
17.71%
1 ene 1987 año
29.768
-11.672
-28.17%
1 ene 1988 año
22.992
-6.776
-22.76%
1 ene 1989 año
31.568
+8.576
37.3%
1 ene 1990 año
31.509
-0.059
-0.19%
1 ene 1991 año
31.421
-0.088
-0.28%
1 ene 1992 año
28.123
-3.299
-10.5%
1 ene 1993 año
29.551
+1.428
5.08%
1 ene 1994 año
31.129
+1.578
5.34%
1 ene 1995 año
43.982
+12.854
41.29%
1 ene 1996 año
38.655
-5.327
-12.11%
1 ene 1997 año
29.046
-9.609
-24.86%
1 ene 1998 año
34.222
+5.176
17.82%
1 ene 1999 año
30.594
-3.628
-10.6%
1 ene 2000 año
32.395
+1.802
5.89%
1 ene 2001 año
29.325
-3.07
-9.48%
1 ene 2002 año
27.378
-1.948
-6.64%
1 ene 2003 año
30.961
+3.583
13.09%
1 ene 2004 año
30.636
-0.325
-1.05%
1 ene 2005 año
31.112
+0.476
1.55%
1 ene 2006 año
34.005
+2.893
9.3%
1 ene 2007 año
28.276
-5.729
-16.85%
1 ene 2008 año
32.137
+3.861
13.65%
1 ene 2009 año
27.155
-4.982
-15.5%
1 ene 2010 año
27.009
-0.146
-0.54%
1 ene 2011 año
30.393
+3.384
12.53%
1 ene 2012 año
27.175
-3.219
-10.59%
1 ene 2013 año
28.719
+1.544
5.68%
1 ene 2014 año
29.626
+0.907
3.16%
1 ene 2015 año
28.655
-0.97
-3.28%
Ranking de los países por los datos estadísticos actuales


Comentarios: