29
/es/
es
AIzaSyAYiBZKx7MnpbEhh9jyipgxe19OcubqV5w
April 1, 2024
112015
Costa Rica
CRI
true
2
1
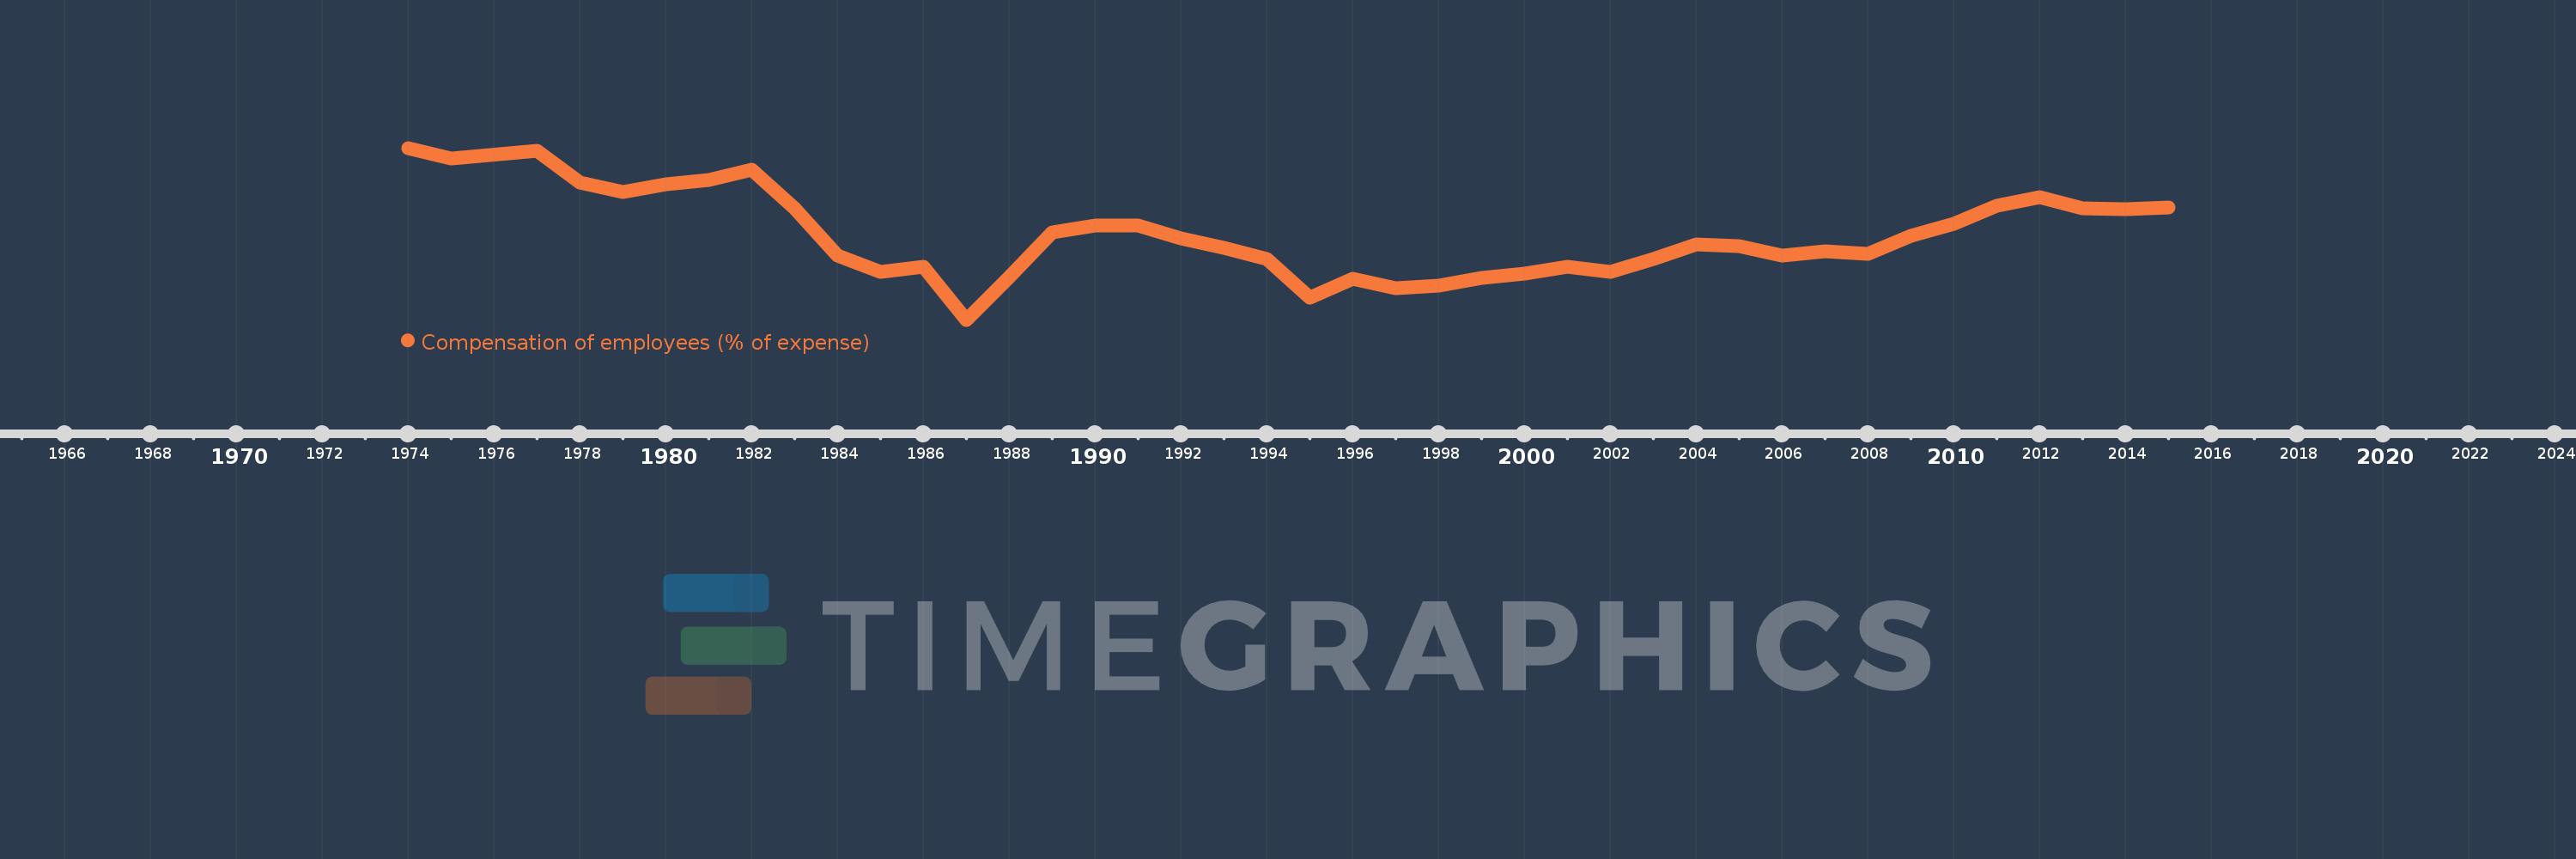
Compensation of employees (% of expense)
2015,2014,2013,2012,2011,2010,2009,2008,2007,2006,2005,2004,2003,2002,2001,2000,1999,1998,1997,1996,1995,1994,1993,1992,1991,1990,1989,1988,1987,1986,1985,1984,1983,1982,1981,1980,1979,1978,1977,1975,1974
Estas estadísticas en otros países:
AfghanistanAlbaniaAlgeriaAngolaAntigua and BarbudaArab WorldArmeniaAustraliaAustriaAzerbaijanBahamas, TheBahrainBangladeshBarbadosBelarusBelgiumBelizeBeninBhutanBoliviaBosnia and HerzegovinaBotswanaBrazilBulgariaBurkina FasoBurundiCabo VerdeCambodiaCanadaCaribbean small statesCentral African RepublicCentral Europe and the BalticsChileColombiaCongo, Dem. Rep.Congo, Rep.Costa RicaCote d'IvoireCroatiaCyprusCzech RepublicDenmarkDominicaDominican RepublicEarly-demographic dividendEast Asia & PacificEast Asia & Pacific (excluding high income)East Asia & Pacific (IDA & IBRD countries)Egypt, Arab Rep.El SalvadorEquatorial GuineaEstoniaEthiopiaEuro areaEurope & Central AsiaEurope & Central Asia (excluding high income)Europe & Central Asia (IDA & IBRD countries)European UnionFijiFinlandFranceGambia, TheGeorgiaGermanyGhanaGreeceGrenadaGuatemalaHeavily indebted poor countries (HIPC)High incomeHondurasHong Kong SAR, ChinaHungaryIBRD onlyIcelandIDA & IBRD totalIDA blendIDA onlyIDA totalIndiaIndonesiaIran, Islamic Rep.IraqIrelandIsraelItalyJamaicaJapanJordanKazakhstanKenyaKiribatiKorea, Rep.KuwaitKyrgyz RepublicLao PDRLate-demographic dividendLatin America & Caribbean Latin America & Caribbean (excluding high income)Latin America & the Caribbean (IDA & IBRD countries)LatviaLeast developed countries: UN classificationLebanonLesothoLiberiaLithuaniaLow & middle incomeLow incomeLower middle incomeLuxembourgMacao SAR, ChinaMacedonia, FYRMadagascarMalawiMalaysiaMaldivesMaliMaltaMauritiusMexicoMicronesia, Fed. Sts.Middle East & North AfricaMiddle East & North Africa (excluding high income)Middle East & North Africa (IDA & IBRD countries)Middle incomeMoldovaMongoliaMoroccoMozambiqueNamibiaNepalNetherlandsNew ZealandNicaraguaNigeriaNorth AmericaNorwayOECD membersOmanOther small statesPakistanPanamaPapua New GuineaParaguayPeruPhilippinesPolandPortugalPost-demographic dividendPre-demographic dividendQatarRomaniaRussian FederationRwandaSamoaSan MarinoSao Tome and PrincipeSenegalSerbiaSeychellesSierra LeoneSingaporeSlovak RepublicSloveniaSmall statesSolomon IslandsSouth AfricaSouth AsiaSouth Asia (IDA & IBRD)SpainSri LankaSt. Kitts and NevisSt. LuciaSub-Saharan Africa Sub-Saharan Africa (excluding high income)Sub-Saharan Africa (IDA & IBRD countries)SurinameSwazilandSwedenSwitzerlandSyrian Arab RepublicTajikistanTanzaniaThailandTimor-LesteTogoTrinidad and TobagoTunisiaTurkeyUgandaUkraineUnited Arab EmiratesUnited KingdomUnited StatesUpper middle incomeUruguayVanuatuVenezuela, RBWest Bank and GazaWorldYemen, Rep.ZambiaZimbabwe línea de tiempo (timeline):
En esta escala de tiempo se presenta un gráfico de 1974 y 2015 de Costa Rica. Los datos de 1973 están ausentes. El número de observaciones reales por fecha: 41.
Fuente (nombre):
Indicadores del desarrollo mundial
Fuente (organización):
International Monetary Fund, Government Finance Statistics Yearbook and data files.
Categorías:
Public Sector
Se ha actualizado:
23 abr 2017 año
Los indicadores de los cambios de valor en los últimos años
Mínimo:
32.837
1 ene 1987 año
Máximo:
55.696
1 ene 1974 año
A la fecha de observación
Valor
Cambio absoluto
El cambio con respecto al valor anterior
1 ene 1974 año
55.696
+55.696
0.0%
1 ene 1975 año
54.271
-1.425
-2.56%
1 ene 1977 año
55.325
+1.054
1.94%
1 ene 1978 año
51.059
-4.267
-7.71%
1 ene 1979 año
49.839
-1.22
-2.39%
1 ene 1980 año
50.815
+0.977
1.96%
1 ene 1981 año
51.454
+0.639
1.26%
1 ene 1982 año
52.759
+1.305
2.54%
1 ene 1983 año
47.625
-5.134
-9.73%
1 ene 1984 año
41.372
-6.253
-13.13%
1 ene 1985 año
39.216
-2.156
-5.21%
1 ene 1986 año
39.86
+0.644
1.64%
1 ene 1987 año
32.837
-7.023
-17.62%
1 ene 1988 año
38.485
+5.647
17.2%
1 ene 1989 año
44.414
+5.93
15.41%
1 ene 1990 año
45.427
+1.012
2.28%
1 ene 1991 año
45.319
-0.107
-0.24%
1 ene 1992 año
43.693
-1.626
-3.59%
1 ene 1993 año
42.352
-1.34
-3.07%
1 ene 1994 año
40.923
-1.429
-3.37%
1 ene 1995 año
35.735
-5.188
-12.68%
1 ene 1996 año
38.274
+2.539
7.11%
1 ene 1997 año
37.014
-1.26
-3.29%
1 ene 1998 año
37.364
+0.35
0.94%
1 ene 1999 año
38.431
+1.067
2.86%
1 ene 2000 año
39.01
+0.579
1.51%
1 ene 2001 año
39.864
+0.855
2.19%
1 ene 2002 año
39.18
-0.684
-1.72%
1 ene 2003 año
40.885
+1.705
4.35%
1 ene 2004 año
42.859
+1.974
4.83%
1 ene 2005 año
42.588
-0.27
-0.63%
1 ene 2006 año
41.413
-1.176
-2.76%
1 ene 2007 año
41.955
+0.543
1.31%
1 ene 2008 año
41.622
-0.333
-0.79%
1 ene 2009 año
43.958
+2.336
5.61%
1 ene 2010 año
45.576
+1.617
3.68%
1 ene 2011 año
47.95
+2.375
5.21%
1 ene 2012 año
49.156
+1.205
2.51%
1 ene 2013 año
47.66
-1.495
-3.04%
1 ene 2014 año
47.521
-0.139
-0.29%
1 ene 2015 año
47.794
+0.272
0.57%
Ranking de los países por los datos estadísticos actuales


Comentarios: