29
/es/
es
AIzaSyAYiBZKx7MnpbEhh9jyipgxe19OcubqV5w
April 1, 2024
121899
Dominican Republic
DOM
true
2
1
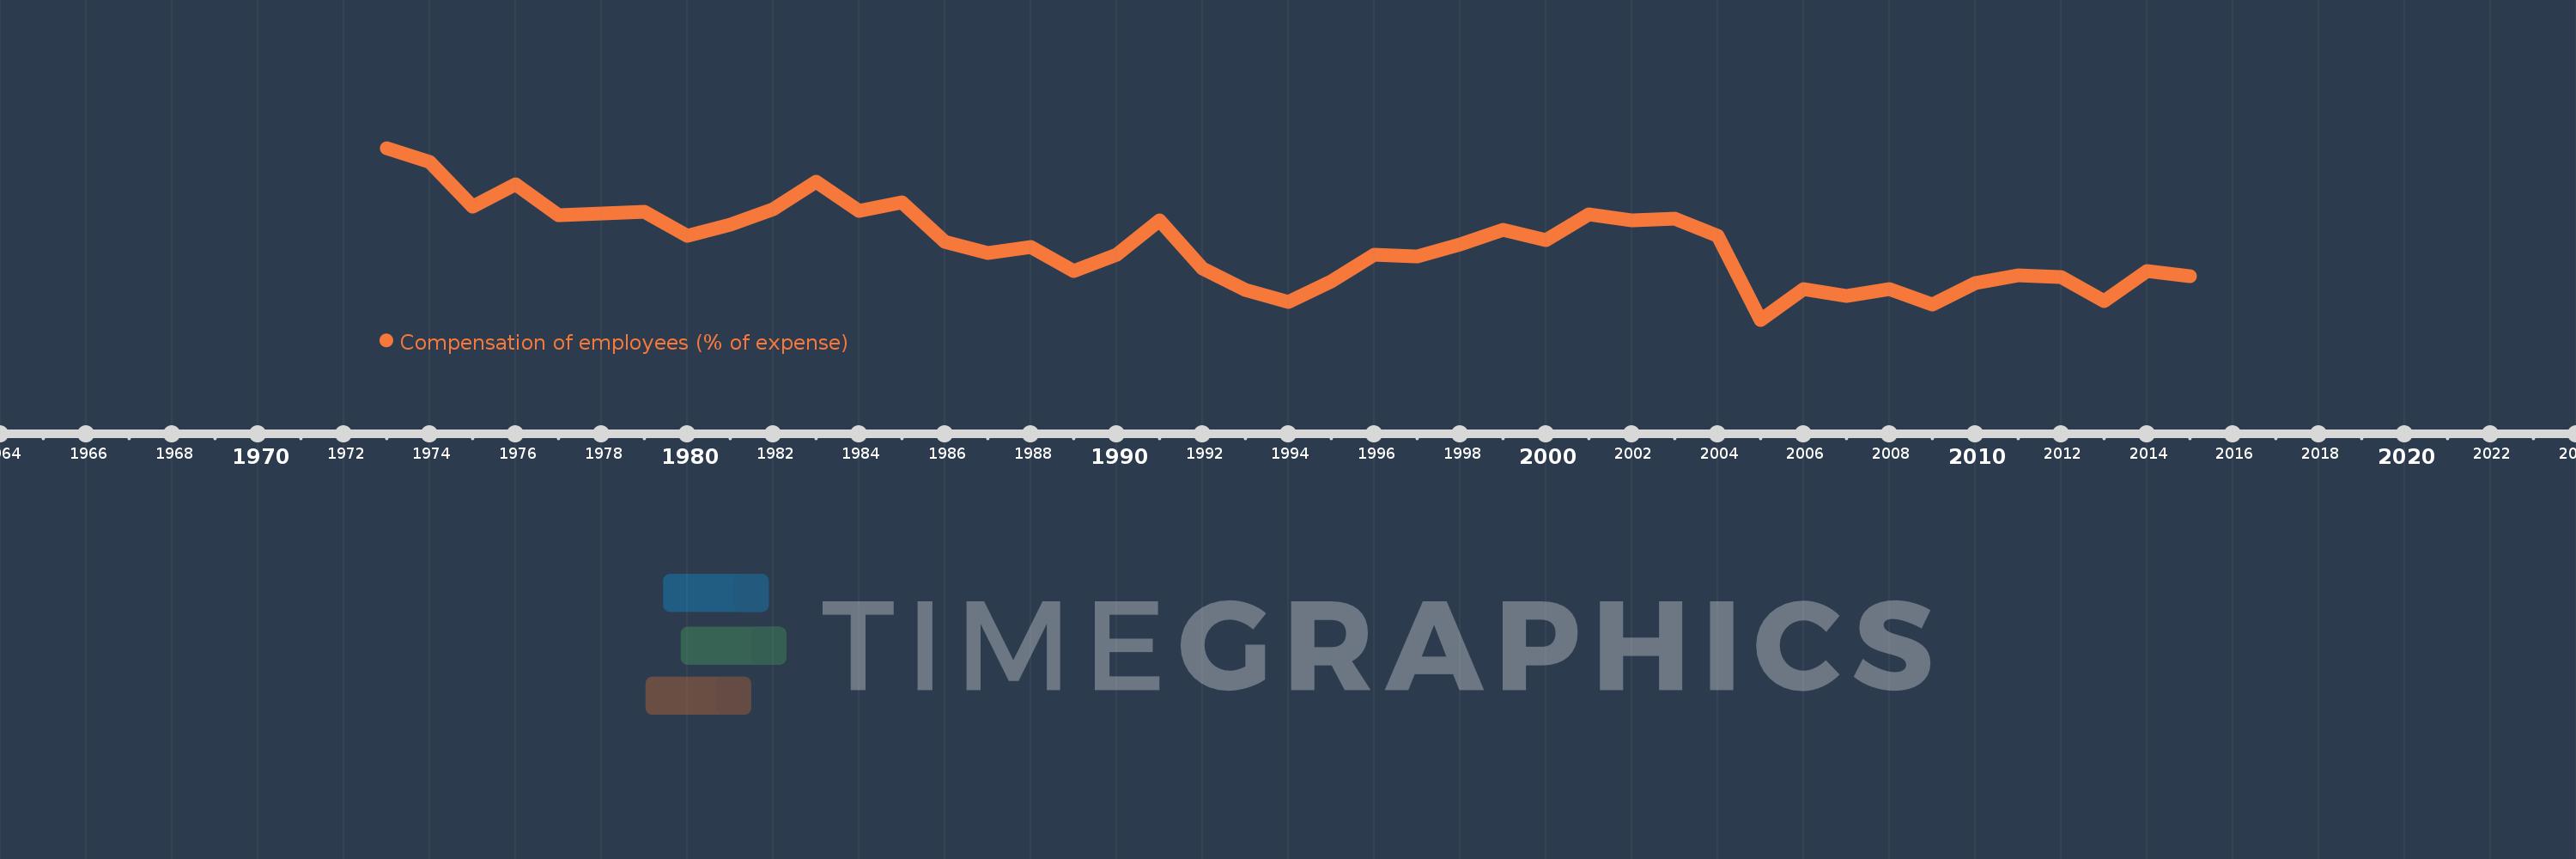
Compensation of employees (% of expense)
2015,2014,2013,2012,2011,2010,2009,2008,2007,2006,2005,2004,2003,2002,2001,2000,1999,1998,1997,1996,1995,1994,1993,1992,1991,1990,1989,1988,1987,1986,1985,1984,1983,1982,1981,1980,1979,1977,1976,1975,1974,1973
Estas estadísticas en otros países:
AfghanistanAlbaniaAlgeriaAngolaAntigua and BarbudaArab WorldArmeniaAustraliaAustriaAzerbaijanBahamas, TheBahrainBangladeshBarbadosBelarusBelgiumBelizeBeninBhutanBoliviaBosnia and HerzegovinaBotswanaBrazilBulgariaBurkina FasoBurundiCabo VerdeCambodiaCanadaCaribbean small statesCentral African RepublicCentral Europe and the BalticsChileColombiaCongo, Dem. Rep.Congo, Rep.Costa RicaCote d'IvoireCroatiaCyprusCzech RepublicDenmarkDominicaDominican RepublicEarly-demographic dividendEast Asia & PacificEast Asia & Pacific (excluding high income)East Asia & Pacific (IDA & IBRD countries)Egypt, Arab Rep.El SalvadorEquatorial GuineaEstoniaEthiopiaEuro areaEurope & Central AsiaEurope & Central Asia (excluding high income)Europe & Central Asia (IDA & IBRD countries)European UnionFijiFinlandFranceGambia, TheGeorgiaGermanyGhanaGreeceGrenadaGuatemalaHeavily indebted poor countries (HIPC)High incomeHondurasHong Kong SAR, ChinaHungaryIBRD onlyIcelandIDA & IBRD totalIDA blendIDA onlyIDA totalIndiaIndonesiaIran, Islamic Rep.IraqIrelandIsraelItalyJamaicaJapanJordanKazakhstanKenyaKiribatiKorea, Rep.KuwaitKyrgyz RepublicLao PDRLate-demographic dividendLatin America & Caribbean Latin America & Caribbean (excluding high income)Latin America & the Caribbean (IDA & IBRD countries)LatviaLeast developed countries: UN classificationLebanonLesothoLiberiaLithuaniaLow & middle incomeLow incomeLower middle incomeLuxembourgMacao SAR, ChinaMacedonia, FYRMadagascarMalawiMalaysiaMaldivesMaliMaltaMauritiusMexicoMicronesia, Fed. Sts.Middle East & North AfricaMiddle East & North Africa (excluding high income)Middle East & North Africa (IDA & IBRD countries)Middle incomeMoldovaMongoliaMoroccoMozambiqueNamibiaNepalNetherlandsNew ZealandNicaraguaNigeriaNorth AmericaNorwayOECD membersOmanOther small statesPakistanPanamaPapua New GuineaParaguayPeruPhilippinesPolandPortugalPost-demographic dividendPre-demographic dividendQatarRomaniaRussian FederationRwandaSamoaSan MarinoSao Tome and PrincipeSenegalSerbiaSeychellesSierra LeoneSingaporeSlovak RepublicSloveniaSmall statesSolomon IslandsSouth AfricaSouth AsiaSouth Asia (IDA & IBRD)SpainSri LankaSt. Kitts and NevisSt. LuciaSub-Saharan Africa Sub-Saharan Africa (excluding high income)Sub-Saharan Africa (IDA & IBRD countries)SurinameSwazilandSwedenSwitzerlandSyrian Arab RepublicTajikistanTanzaniaThailandTimor-LesteTogoTrinidad and TobagoTunisiaTurkeyUgandaUkraineUnited Arab EmiratesUnited KingdomUnited StatesUpper middle incomeUruguayVanuatuVenezuela, RBWest Bank and GazaWorldYemen, Rep.ZambiaZimbabwe línea de tiempo (timeline):
En esta escala de tiempo se presenta un gráfico de 1973 y 2015 de Dominican Republic. Los datos de 1972 están ausentes. El número de observaciones reales por fecha: 42.
Fuente (nombre):
Indicadores del desarrollo mundial
Fuente (organización):
International Monetary Fund, Government Finance Statistics Yearbook and data files.
Categorías:
Public Sector
Se ha actualizado:
23 abr 2017 año
Los indicadores de los cambios de valor en los últimos años
Mínimo:
28.215
1 ene 2005 año
Máximo:
62.799
1 ene 1973 año
A la fecha de observación
Valor
Cambio absoluto
El cambio con respecto al valor anterior
1 ene 1973 año
62.799
+62.799
0.0%
1 ene 1974 año
59.928
-2.871
-4.57%
1 ene 1975 año
50.94
-8.988
-15.0%
1 ene 1976 año
55.43
+4.49
8.81%
1 ene 1977 año
49.294
-6.137
-11.07%
1 ene 1979 año
49.951
+0.658
1.33%
1 ene 1980 año
45.036
-4.916
-9.84%
1 ene 1981 año
47.401
+2.366
5.25%
1 ene 1982 año
50.418
+3.017
6.36%
1 ene 1983 año
55.992
+5.574
11.06%
1 ene 1984 año
50.143
-5.849
-10.45%
1 ene 1985 año
51.767
+1.624
3.24%
1 ene 1986 año
43.827
-7.94
-15.34%
1 ene 1987 año
41.724
-2.103
-4.8%
1 ene 1988 año
42.817
+1.092
2.62%
1 ene 1989 año
37.951
-4.866
-11.36%
1 ene 1990 año
41.235
+3.284
8.65%
1 ene 1991 año
48.191
+6.955
16.87%
1 ene 1992 año
38.566
-9.624
-19.97%
1 ene 1993 año
34.261
-4.305
-11.16%
1 ene 1994 año
31.729
-2.532
-7.39%
1 ene 1995 año
36.005
+4.276
13.48%
1 ene 1996 año
41.257
+5.252
14.59%
1 ene 1997 año
40.891
-0.366
-0.89%
1 ene 1998 año
43.409
+2.518
6.16%
1 ene 1999 año
46.342
+2.933
6.76%
1 ene 2000 año
44.315
-2.027
-4.37%
1 ene 2001 año
49.45
+5.135
11.59%
1 ene 2002 año
48.297
-1.153
-2.33%
1 ene 2003 año
48.531
+0.234
0.48%
1 ene 2004 año
45.159
-3.371
-6.95%
1 ene 2005 año
28.215
-16.944
-37.52%
1 ene 2006 año
34.435
+6.22
22.04%
1 ene 2007 año
33.038
-1.397
-4.06%
1 ene 2008 año
34.461
+1.422
4.31%
1 ene 2009 año
31.317
-3.144
-9.12%
1 ene 2010 año
35.683
+4.367
13.94%
1 ene 2011 año
37.206
+1.523
4.27%
1 ene 2012 año
36.775
-0.431
-1.16%
1 ene 2013 año
32.003
-4.773
-12.98%
1 ene 2014 año
37.985
+5.982
18.69%
1 ene 2015 año
37.023
-0.962
-2.53%
Ranking de los países por los datos estadísticos actuales


Comentarios: