29
/es/
es
AIzaSyAYiBZKx7MnpbEhh9jyipgxe19OcubqV5w
April 1, 2024
225715
Portugal
PRT
true
2
1
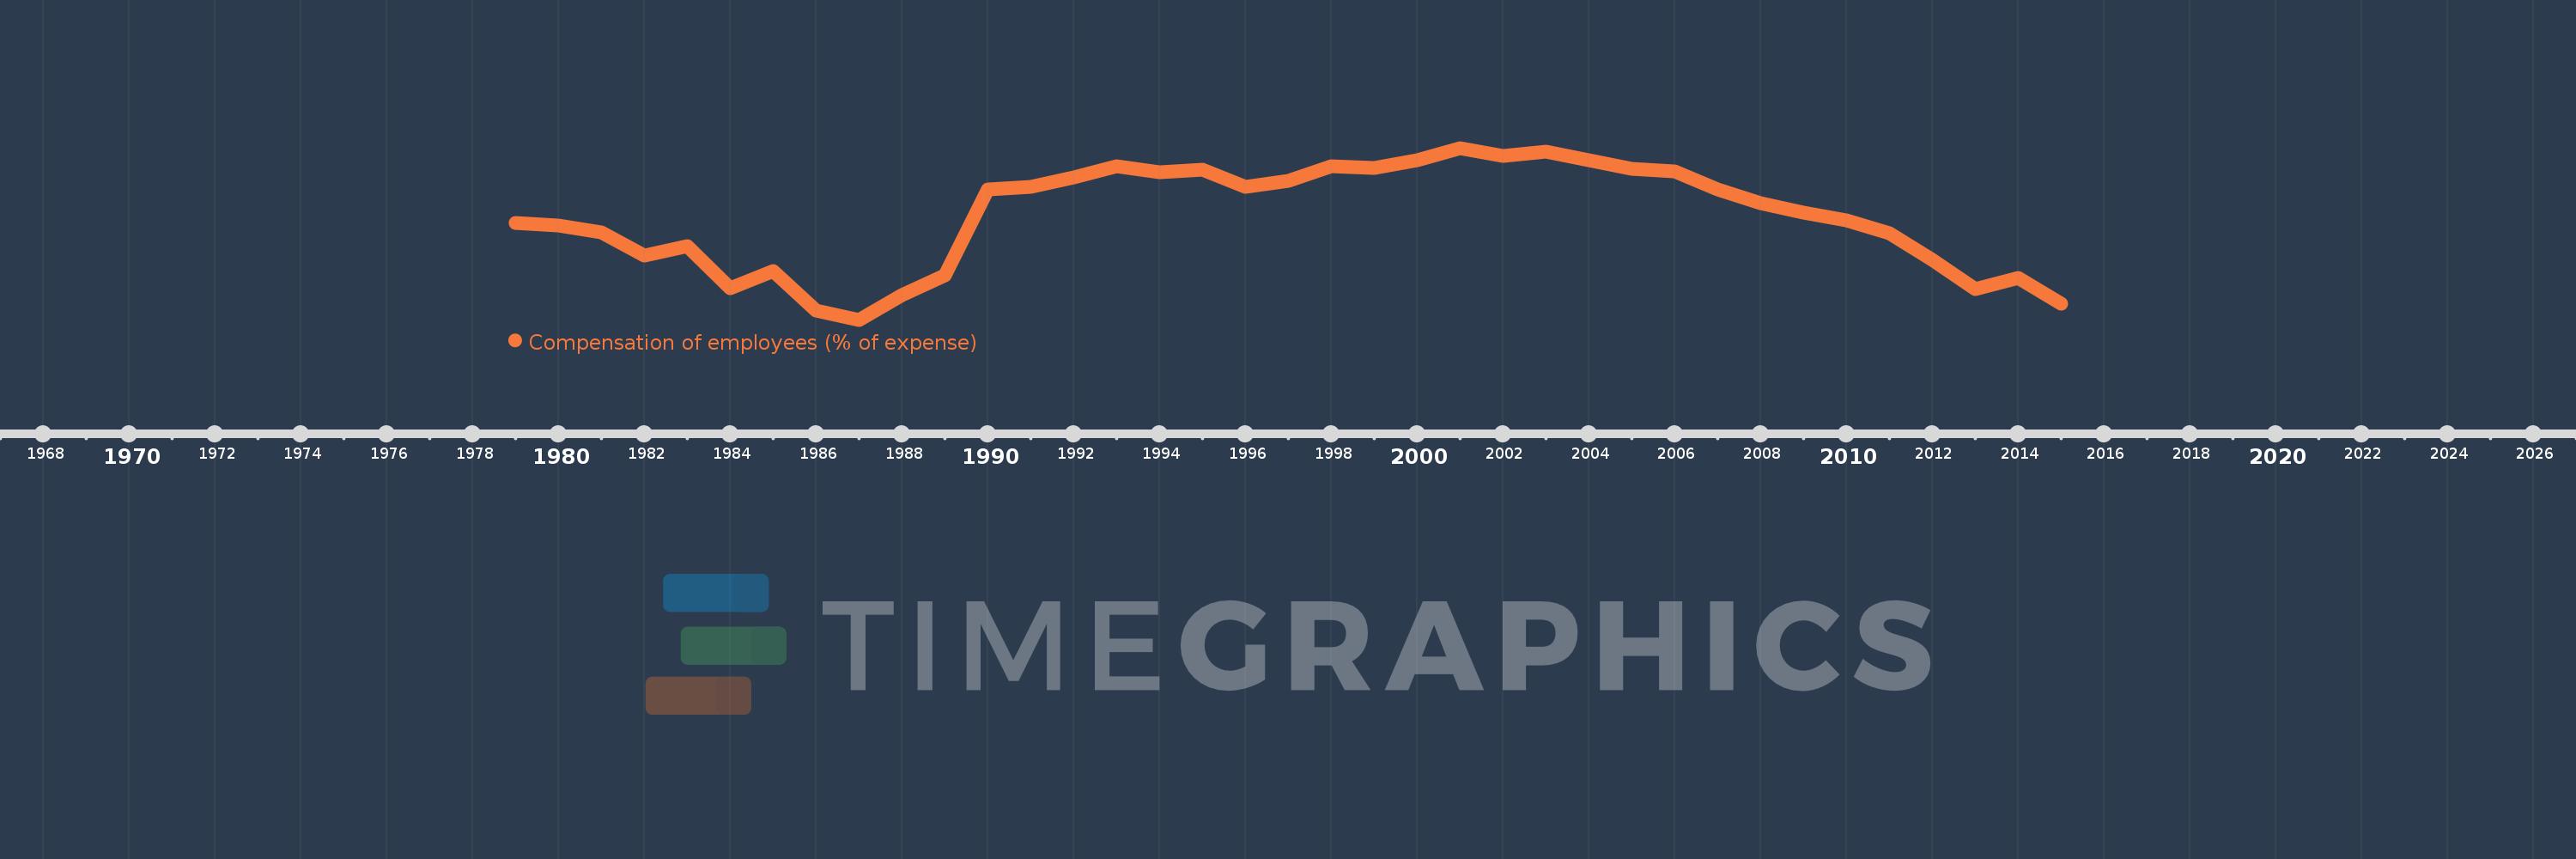
Compensation of employees (% of expense)
2015,2014,2013,2012,2011,2010,2009,2008,2007,2006,2005,2004,2003,2002,2001,2000,1999,1998,1997,1996,1995,1994,1993,1992,1991,1990,1989,1988,1987,1986,1985,1984,1983,1982,1981,1980,1979
Estas estadísticas en otros países:
AfghanistanAlbaniaAlgeriaAngolaAntigua and BarbudaArab WorldArmeniaAustraliaAustriaAzerbaijanBahamas, TheBahrainBangladeshBarbadosBelarusBelgiumBelizeBeninBhutanBoliviaBosnia and HerzegovinaBotswanaBrazilBulgariaBurkina FasoBurundiCabo VerdeCambodiaCanadaCaribbean small statesCentral African RepublicCentral Europe and the BalticsChileColombiaCongo, Dem. Rep.Congo, Rep.Costa RicaCote d'IvoireCroatiaCyprusCzech RepublicDenmarkDominicaDominican RepublicEarly-demographic dividendEast Asia & PacificEast Asia & Pacific (excluding high income)East Asia & Pacific (IDA & IBRD countries)Egypt, Arab Rep.El SalvadorEquatorial GuineaEstoniaEthiopiaEuro areaEurope & Central AsiaEurope & Central Asia (excluding high income)Europe & Central Asia (IDA & IBRD countries)European UnionFijiFinlandFranceGambia, TheGeorgiaGermanyGhanaGreeceGrenadaGuatemalaHeavily indebted poor countries (HIPC)High incomeHondurasHong Kong SAR, ChinaHungaryIBRD onlyIcelandIDA & IBRD totalIDA blendIDA onlyIDA totalIndiaIndonesiaIran, Islamic Rep.IraqIrelandIsraelItalyJamaicaJapanJordanKazakhstanKenyaKiribatiKorea, Rep.KuwaitKyrgyz RepublicLao PDRLate-demographic dividendLatin America & Caribbean Latin America & Caribbean (excluding high income)Latin America & the Caribbean (IDA & IBRD countries)LatviaLeast developed countries: UN classificationLebanonLesothoLiberiaLithuaniaLow & middle incomeLow incomeLower middle incomeLuxembourgMacao SAR, ChinaMacedonia, FYRMadagascarMalawiMalaysiaMaldivesMaliMaltaMauritiusMexicoMicronesia, Fed. Sts.Middle East & North AfricaMiddle East & North Africa (excluding high income)Middle East & North Africa (IDA & IBRD countries)Middle incomeMoldovaMongoliaMoroccoMozambiqueNamibiaNepalNetherlandsNew ZealandNicaraguaNigeriaNorth AmericaNorwayOECD membersOmanOther small statesPakistanPanamaPapua New GuineaParaguayPeruPhilippinesPolandPortugalPost-demographic dividendPre-demographic dividendQatarRomaniaRussian FederationRwandaSamoaSan MarinoSao Tome and PrincipeSenegalSerbiaSeychellesSierra LeoneSingaporeSlovak RepublicSloveniaSmall statesSolomon IslandsSouth AfricaSouth AsiaSouth Asia (IDA & IBRD)SpainSri LankaSt. Kitts and NevisSt. LuciaSub-Saharan Africa Sub-Saharan Africa (excluding high income)Sub-Saharan Africa (IDA & IBRD countries)SurinameSwazilandSwedenSwitzerlandSyrian Arab RepublicTajikistanTanzaniaThailandTimor-LesteTogoTrinidad and TobagoTunisiaTurkeyUgandaUkraineUnited Arab EmiratesUnited KingdomUnited StatesUpper middle incomeUruguayVanuatuVenezuela, RBWest Bank and GazaWorldYemen, Rep.ZambiaZimbabwe línea de tiempo (timeline):
En esta escala de tiempo se presenta un gráfico de 1979 y 2015 de Portugal. Los datos de 1978 están ausentes. El número de observaciones reales por fecha: 37.
Fuente (nombre):
Indicadores del desarrollo mundial
Fuente (organización):
International Monetary Fund, Government Finance Statistics Yearbook and data files.
Categorías:
Public Sector
Se ha actualizado:
23 abr 2017 año
Los indicadores de los cambios de valor en los últimos años
Mínimo:
19.155
1 ene 1987 año
Máximo:
31.874
1 ene 2001 año
A la fecha de observación
Valor
Cambio absoluto
El cambio con respecto al valor anterior
1 ene 1979 año
26.296
+26.296
0.0%
1 ene 1980 año
26.131
-0.166
-0.63%
1 ene 1981 año
25.649
-0.482
-1.84%
1 ene 1982 año
23.892
-1.757
-6.85%
1 ene 1983 año
24.621
+0.729
3.05%
1 ene 1984 año
21.482
-3.138
-12.75%
1 ene 1985 año
22.744
+1.262
5.87%
1 ene 1986 año
19.841
-2.903
-12.76%
1 ene 1987 año
19.155
-0.686
-3.46%
1 ene 1988 año
20.955
+1.8
9.4%
1 ene 1989 año
22.46
+1.504
7.18%
1 ene 1990 año
28.808
+6.349
28.27%
1 ene 1991 año
28.974
+0.165
0.57%
1 ene 1992 año
29.708
+0.735
2.54%
1 ene 1993 año
30.517
+0.808
2.72%
1 ene 1994 año
30.092
-0.424
-1.39%
1 ene 1995 año
30.254
+0.162
0.54%
1 ene 1996 año
28.979
-1.275
-4.21%
1 ene 1997 año
29.467
+0.488
1.68%
1 ene 1998 año
30.539
+1.072
3.64%
1 ene 1999 año
30.412
-0.127
-0.41%
1 ene 2000 año
30.985
+0.573
1.89%
1 ene 2001 año
31.874
+0.889
2.87%
1 ene 2002 año
31.279
-0.595
-1.87%
1 ene 2003 año
31.584
+0.305
0.97%
1 ene 2004 año
30.951
-0.633
-2.01%
1 ene 2005 año
30.328
-0.623
-2.01%
1 ene 2006 año
30.127
-0.201
-0.66%
1 ene 2007 año
28.834
-1.293
-4.29%
1 ene 2008 año
27.789
-1.045
-3.62%
1 ene 2009 año
27.057
-0.732
-2.63%
1 ene 2010 año
26.503
-0.555
-2.05%
1 ene 2011 año
25.535
-0.967
-3.65%
1 ene 2012 año
23.584
-1.951
-7.64%
1 ene 2013 año
21.406
-2.178
-9.23%
1 ene 2014 año
22.263
+0.857
4.0%
1 ene 2015 año
20.355
-1.908
-8.57%
Ranking de los países por los datos estadísticos actuales


Comentarios: