29
/es/
es
AIzaSyAYiBZKx7MnpbEhh9jyipgxe19OcubqV5w
April 1, 2024
235853
Senegal
SEN
true
2
1
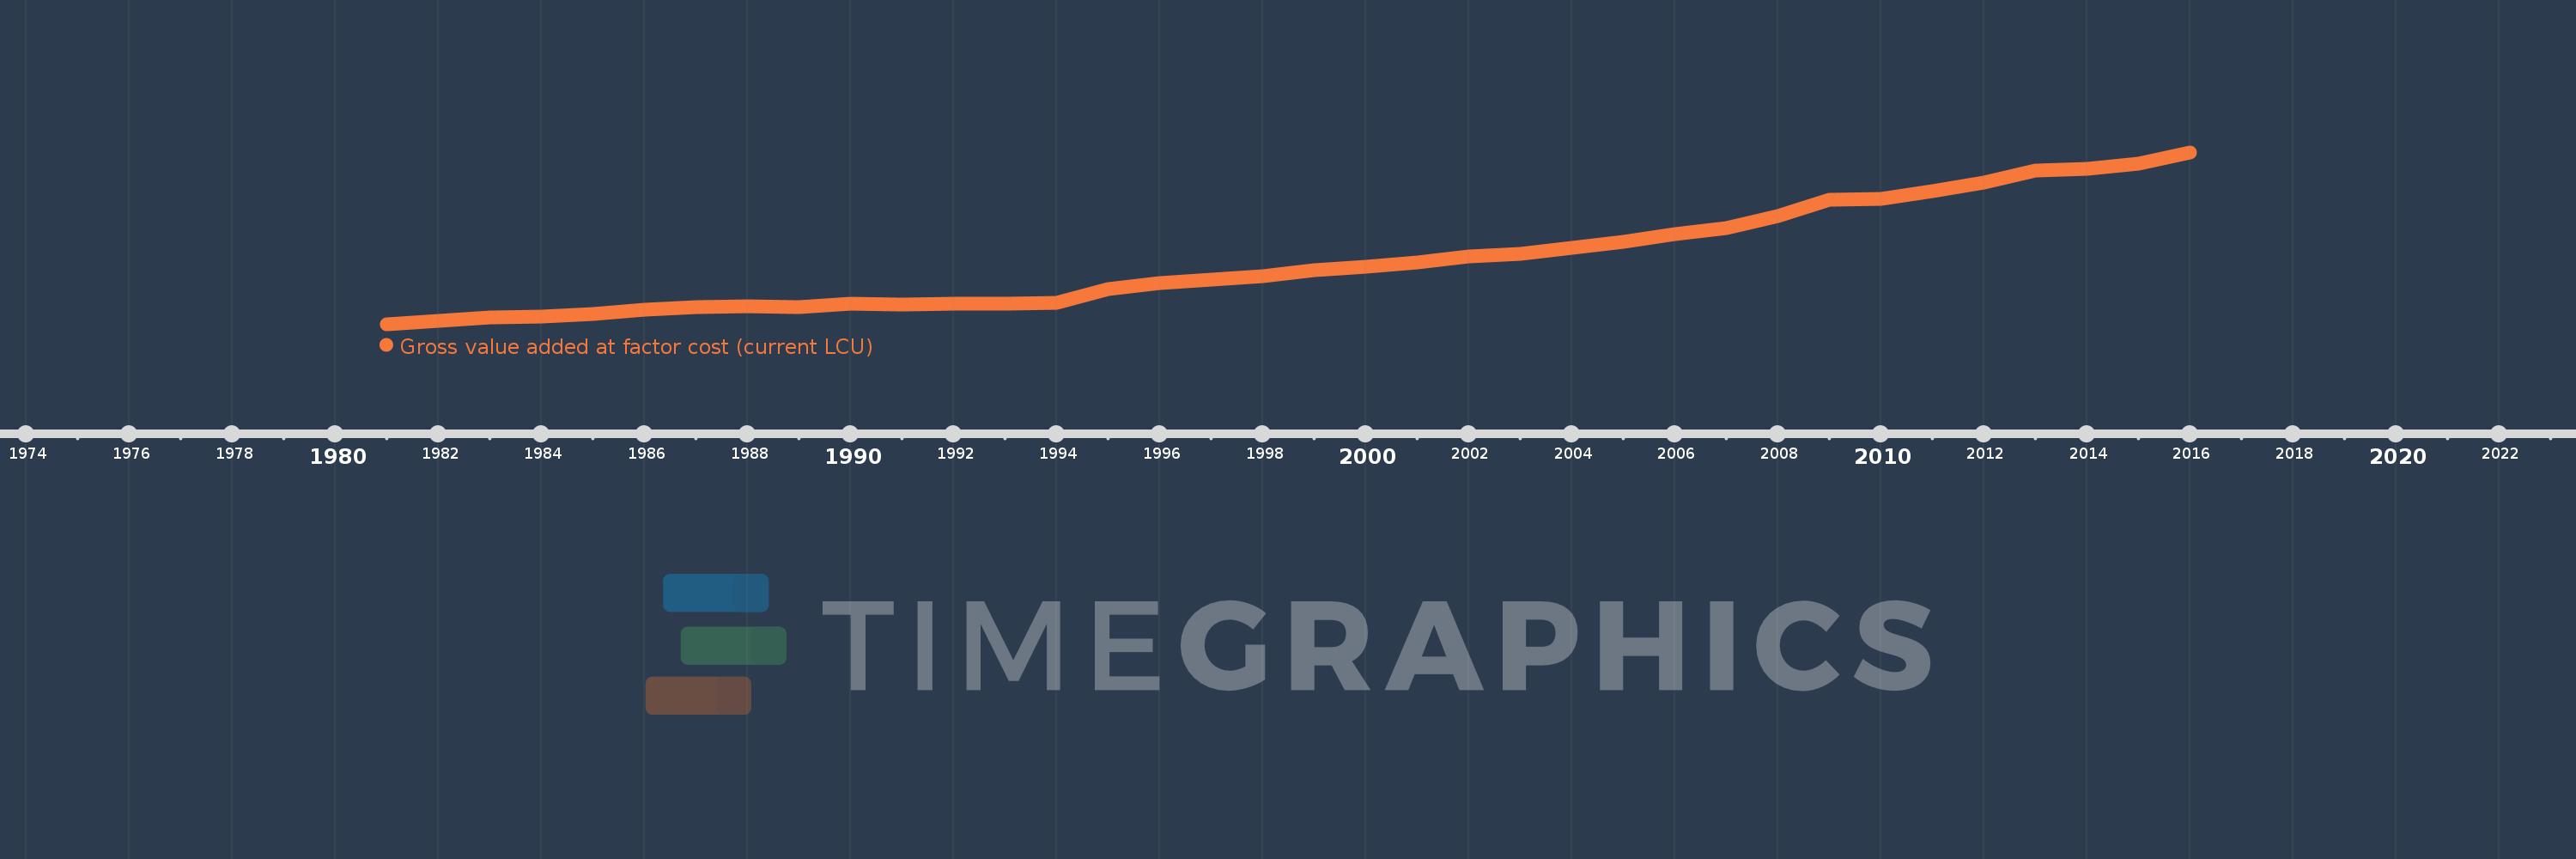
Gross value added at factor cost (current LCU)
2016,2015,2014,2013,2012,2011,2010,2009,2008,2007,2006,2005,2004,2003,2002,2001,2000,1999,1998,1997,1996,1995,1994,1993,1992,1991,1990,1989,1988,1987,1986,1985,1984,1983,1982,1981
Estas estadísticas en otros países:
AfghanistanAlbaniaAlgeriaAndorraAntigua and BarbudaArgentinaArmeniaArubaAustraliaAustriaAzerbaijanBahamas, TheBahrainBangladeshBarbadosBelarusBelgiumBelizeBeninBermudaBhutanBoliviaBosnia and HerzegovinaBotswanaBrazilBulgariaBurkina FasoBurundiCabo VerdeCambodiaCameroonCanadaCayman IslandsCentral African RepublicChadChileColombiaCongo, Dem. Rep.Costa RicaCroatiaCubaCyprusCzech RepublicDenmarkDjiboutiDominicaDominican RepublicEcuadorEgypt, Arab Rep.El SalvadorEquatorial GuineaEritreaEstoniaEthiopiaFaroe IslandsFijiFinlandFranceGabonGambia, TheGeorgiaGermanyGhanaGreeceGrenadaGuatemalaGuineaGuinea-BissauGuyanaHondurasHong Kong SAR, ChinaHungaryIcelandIndiaIndonesiaIran, Islamic Rep.IrelandItalyJamaicaJapanJordanKazakhstanKenyaKiribatiKorea, Rep.KosovoKuwaitKyrgyz RepublicLao PDRLatviaLebanonLesothoLiberiaLibyaLiechtensteinLithuaniaLuxembourgMacao SAR, ChinaMacedonia, FYRMadagascarMalawiMalaysiaMaldivesMaliMaltaMarshall IslandsMauritaniaMauritiusMexicoMicronesia, Fed. Sts.MoldovaMongoliaMontenegroMoroccoMozambiqueNamibiaNepalNetherlandsNew ZealandNicaraguaNigeriaNorwayOmanPakistanPalauPanamaPapua New GuineaParaguayPeruPolandPortugalRomaniaRussian FederationRwandaSao Tome and PrincipeSenegalSerbiaSeychellesSierra LeoneSingaporeSlovak RepublicSloveniaSolomon IslandsSomaliaSouth AfricaSpainSri LankaSt. Kitts and NevisSt. LuciaSt. Vincent and the GrenadinesSudanSurinameSwazilandSwedenSwitzerlandSyrian Arab RepublicTajikistanTanzaniaThailandTimor-LesteTongaTrinidad and TobagoTunisiaTurkeyTurkmenistanTuvaluUgandaUkraineUnited KingdomUnited StatesUruguayUzbekistanVanuatuVenezuela, RBVietnamWest Bank and GazaYemen, Rep.ZambiaZimbabwe línea de tiempo (timeline):
En esta escala de tiempo se presenta un gráfico de 1981 y 2016 de Senegal. Los datos de 1980 están ausentes. El número de observaciones reales por fecha: 36.
Fuente (nombre):
Indicadores del desarrollo mundial
Fuente (organización):
World Bank national accounts data, and OECD National Accounts data files.
Categorías:
Economy & Growth
Se ha actualizado:
23 abr 2017 año
Los indicadores de los cambios de valor en los últimos años
En promedio:
3.022 billones
Mínimo:
658.906 bn
1 ene 1981 año
Máximo:
7.02 billones
1 ene 2016 año
A la fecha de observación
Valor
Cambio absoluto
El cambio con respecto al valor anterior
1 ene 1981 año
658.906 bn
+658.906 bn
0.0%
1 ene 1982 año
774.038 bn
+115.132 bn
17.47%
1 ene 1983 año
913.492 bn
+139.454 bn
18.02%
1 ene 1984 año
933.601 bn
+20.109 bn
2.2%
1 ene 1985 año
1.047 billones
+113.241 bn
12.13%
1 ene 1986 año
1.182 billones
+135.356 bn
12.93%
1 ene 1987 año
1.278 billones
+95.334 bn
8.06%
1 ene 1988 año
1.331 billones
+53.052 bn
4.15%
1 ene 1989 año
1.307 billones
-23.857 bn
-1.79%
1 ene 1990 año
1.427 billones
+120.096 bn
9.19%
1 ene 1991 año
1.399 billones
-28.116 bn
-1.97%
1 ene 1992 año
1.416 billones
+16.964 bn
1.21%
1 ene 1993 año
1.421 billones
+5.106 bn
0.36%
1 ene 1994 año
1.457 billones
+36.516 bn
2.57%
1 ene 1995 año
1.96 billones
+502.406 bn
34.48%
1 ene 1996 año
2.195 billones
+235.518 bn
12.02%
1 ene 1997 año
2.318 billones
+122.375 bn
5.57%
1 ene 1998 año
2.434 billones
+116.35 bn
5.02%
1 ene 1999 año
2.651 billones
+216.595 bn
8.9%
1 ene 2000 año
2.787 billones
+136.681 bn
5.16%
1 ene 2001 año
2.935 billones
+147.433 bn
5.29%
1 ene 2002 año
3.157 billones
+222.081 bn
7.57%
1 ene 2003 año
3.261 billones
+104.046 bn
3.3%
1 ene 2004 año
3.5 billones
+239.468 bn
7.34%
1 ene 2005 año
3.715 billones
+214.758 bn
6.14%
1 ene 2006 año
3.992 billones
+277.011 bn
7.46%
1 ene 2007 año
4.232 billones
+240.0 bn
6.01%
1 ene 2008 año
4.666 billones
+433.57 bn
10.25%
1 ene 2009 año
5.255 billones
+589.22 bn
12.63%
1 ene 2010 año
5.304 billones
+49.39 bn
0.94%
1 ene 2011 año
5.6 billones
+295.353 bn
5.57%
1 ene 2012 año
5.896 billones
+296.584 bn
5.3%
1 ene 2013 año
6.36 billones
+464.236 bn
7.87%
1 ene 2014 año
6.419 billones
+58.826 bn
0.92%
1 ene 2015 año
6.596 billones
+176.609 bn
2.75%
1 ene 2016 año
7.02 billones
+424.409 bn
6.43%
Ranking de los países por los datos estadísticos actuales


Comentarios: