29
/es/
es
AIzaSyAYiBZKx7MnpbEhh9jyipgxe19OcubqV5w
April 1, 2024
124880
Egypt, Arab Rep.
EGY
true
2
1
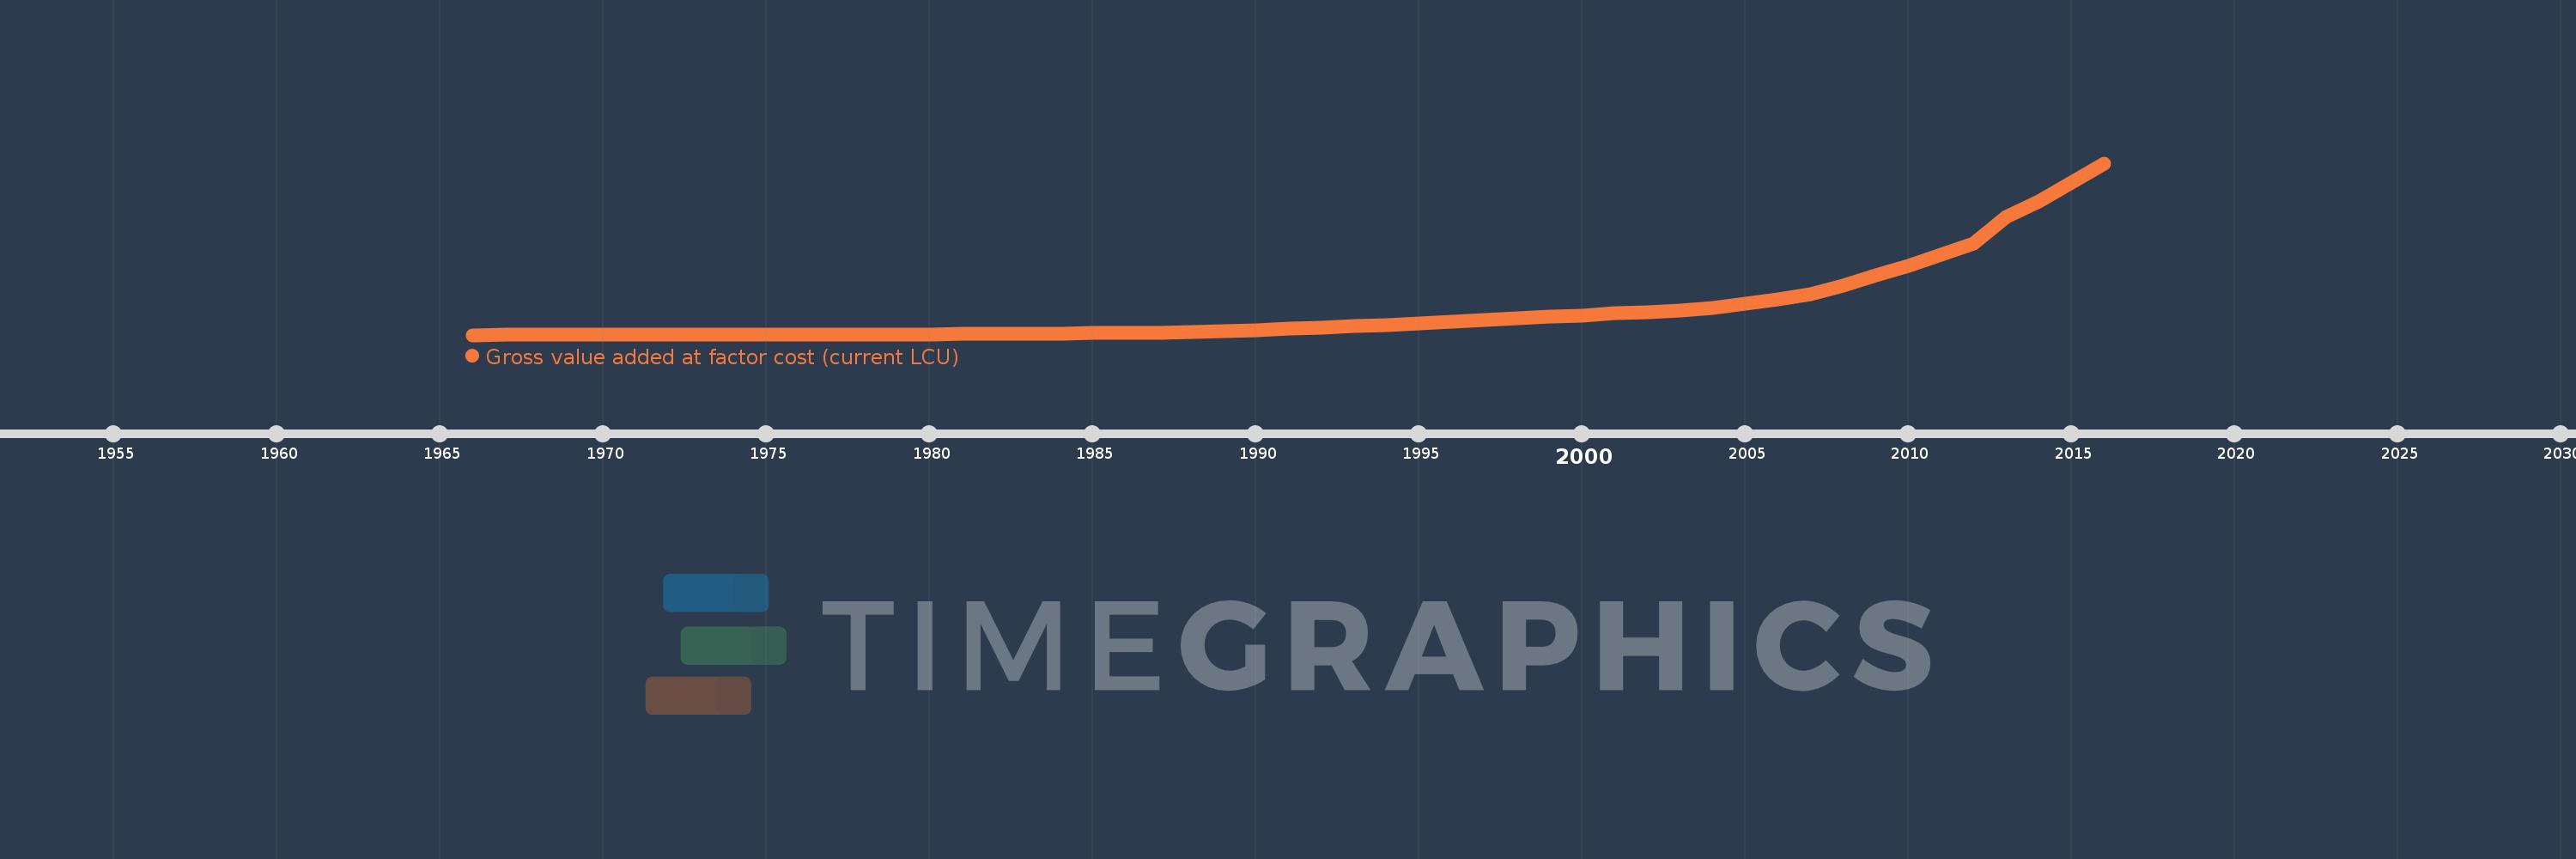
Gross value added at factor cost (current LCU)
2016,2015,2014,2013,2012,2011,2010,2009,2008,2007,2006,2005,2004,2003,2002,2001,2000,1999,1998,1997,1996,1995,1994,1993,1992,1991,1990,1989,1988,1987,1986,1985,1984,1983,1982,1981,1980,1979,1978,1977,1976,1975,1974,1973,1972,1971,1970,1969,1968,1967,1966
Estas estadísticas en otros países:
AfghanistanAlbaniaAlgeriaAndorraAntigua and BarbudaArgentinaArmeniaArubaAustraliaAustriaAzerbaijanBahamas, TheBahrainBangladeshBarbadosBelarusBelgiumBelizeBeninBermudaBhutanBoliviaBosnia and HerzegovinaBotswanaBrazilBulgariaBurkina FasoBurundiCabo VerdeCambodiaCameroonCanadaCayman IslandsCentral African RepublicChadChileColombiaCongo, Dem. Rep.Costa RicaCroatiaCubaCyprusCzech RepublicDenmarkDjiboutiDominicaDominican RepublicEcuadorEgypt, Arab Rep.El SalvadorEquatorial GuineaEritreaEstoniaEthiopiaFaroe IslandsFijiFinlandFranceGabonGambia, TheGeorgiaGermanyGhanaGreeceGrenadaGuatemalaGuineaGuinea-BissauGuyanaHondurasHong Kong SAR, ChinaHungaryIcelandIndiaIndonesiaIran, Islamic Rep.IrelandItalyJamaicaJapanJordanKazakhstanKenyaKiribatiKorea, Rep.KosovoKuwaitKyrgyz RepublicLao PDRLatviaLebanonLesothoLiberiaLibyaLiechtensteinLithuaniaLuxembourgMacao SAR, ChinaMacedonia, FYRMadagascarMalawiMalaysiaMaldivesMaliMaltaMarshall IslandsMauritaniaMauritiusMexicoMicronesia, Fed. Sts.MoldovaMongoliaMontenegroMoroccoMozambiqueNamibiaNepalNetherlandsNew ZealandNicaraguaNigeriaNorwayOmanPakistanPalauPanamaPapua New GuineaParaguayPeruPolandPortugalRomaniaRussian FederationRwandaSao Tome and PrincipeSenegalSerbiaSeychellesSierra LeoneSingaporeSlovak RepublicSloveniaSolomon IslandsSomaliaSouth AfricaSpainSri LankaSt. Kitts and NevisSt. LuciaSt. Vincent and the GrenadinesSudanSurinameSwazilandSwedenSwitzerlandSyrian Arab RepublicTajikistanTanzaniaThailandTimor-LesteTongaTrinidad and TobagoTunisiaTurkeyTurkmenistanTuvaluUgandaUkraineUnited KingdomUnited StatesUruguayUzbekistanVanuatuVenezuela, RBVietnamWest Bank and GazaYemen, Rep.ZambiaZimbabwe línea de tiempo (timeline):
En esta escala de tiempo se presenta un gráfico de 1966 y 2016 de Egypt, Arab Rep.. Los datos de 1965 están ausentes. El número de observaciones reales por fecha: 51.
Fuente (nombre):
Indicadores del desarrollo mundial
Fuente (organización):
World Bank national accounts data, and OECD National Accounts data files.
Categorías:
Economy & Growth
Se ha actualizado:
23 abr 2017 año
Los indicadores de los cambios de valor en los últimos años
Mínimo:
2.081 bn
1 ene 1966 año
Máximo:
2.459 billones
1 ene 2016 año
A la fecha de observación
Valor
Cambio absoluto
El cambio con respecto al valor anterior
1 ene 1966 año
2.081 bn
+2.081 bn
0.0%
1 ene 1967 año
2.184 bn
+102.9 millones
4.94%
1 ene 1968 año
2.2 bn
+15.9 millones
0.73%
1 ene 1969 año
2.264 bn
+63.4 millones
2.88%
1 ene 1970 año
2.446 bn
+182.5 millones
8.06%
1 ene 1971 año
2.627 bn
+180.6 millones
7.38%
1 ene 1972 año
2.792 bn
+165.6 millones
6.3%
1 ene 1973 año
3.002 bn
+209.6 millones
7.51%
1 ene 1974 año
3.465 bn
+462.6 millones
15.41%
1 ene 1975 año
4.197 bn
+732.5 millones
21.14%
1 ene 1976 año
5.056 bn
+859.0 millones
20.47%
1 ene 1977 año
6.165 bn
+1.109 bn
21.93%
1 ene 1978 año
7.534 bn
+1.369 bn
22.21%
1 ene 1979 año
9.021 bn
+1.487 bn
19.74%
1 ene 1980 año
12.101 bn
+3.08 bn
34.14%
1 ene 1981 año
15.74 bn
+3.639 bn
30.07%
1 ene 1982 año
16.552 bn
+811.999 millones
5.16%
1 ene 1983 año
20.097 bn
+3.545 bn
21.42%
1 ene 1984 año
23.241 bn
+3.144 bn
15.64%
1 ene 1985 año
27.401 bn
+4.16 bn
17.9%
1 ene 1986 año
31.952 bn
+4.551 bn
16.61%
1 ene 1987 año
36.231 bn
+4.279 bn
13.39%
1 ene 1988 año
49.335 bn
+13.104 bn
36.17%
1 ene 1989 año
58.63 bn
+9.295 bn
18.84%
1 ene 1990 año
73.17 bn
+14.54 bn
24.8%
1 ene 1991 año
91.575 bn
+18.405 bn
25.15%
1 ene 1992 año
108.74 bn
+17.165 bn
18.74%
1 ene 1993 año
131.057 bn
+22.317 bn
20.52%
1 ene 1994 año
146.16 bn
+15.103 bn
11.52%
1 ene 1995 año
162.967 bn
+16.807 bn
11.5%
1 ene 1996 año
191.01 bn
+28.043 bn
17.21%
1 ene 1997 año
214.185 bn
+23.175 bn
12.13%
1 ene 1998 año
247.028 bn
+32.843 bn
15.33%
1 ene 1999 año
266.757 bn
+19.729 bn
7.99%
1 ene 2000 año
282.578 bn
+15.82 bn
5.93%
1 ene 2001 año
315.667 bn
+33.089 bn
11.71%
1 ene 2002 año
332.544 bn
+16.877 bn
5.35%
1 ene 2003 año
354.564 bn
+22.02 bn
6.62%
1 ene 2004 año
390.619 bn
+36.056 bn
10.17%
1 ene 2005 año
456.322 bn
+65.703 bn
16.82%
1 ene 2006 año
506.152 bn
+49.83 bn
10.92%
1 ene 2007 año
581.144 bn
+74.992 bn
14.82%
1 ene 2008 año
710.387 bn
+129.243 bn
22.24%
1 ene 2009 año
855.302 bn
+144.915 bn
20.4%
1 ene 2010 año
994.055 bn
+138.753 bn
16.22%
1 ene 2011 año
1.151 billones
+156.535 bn
15.75%
1 ene 2012 año
1.31 billones
+159.316 bn
13.85%
1 ene 2013 año
1.695 billones
+385.19 bn
29.41%
1 ene 2014 año
1.908 billones
+213.219 bn
12.58%
1 ene 2015 año
2.178 billones
+269.505 bn
14.12%
1 ene 2016 año
2.459 billones
+281.205 bn
12.91%
Ranking de los países por los datos estadísticos actuales


Comentarios: